SunTrust 2006 Annual Report Download - page 112
Download and view the complete annual report
Please find page 112 of the 2006 SunTrust annual report below. You can navigate through the pages in the report by either clicking on the pages listed below, or by using the keyword search tool below to find specific information within the annual report.-
 1
1 -
2
-
3
-
4
-
5
-
6
-
7
-
8
-
9
-
10
-
11
-
12
-
13
-
14
-
15
-
16
-
17
-
18
-
19
-
20
-
21
-
22
-
23
-
24
-
25
-
26
-
27
-
28
-
29
-
30
-
31
-
32
-
33
-
34
-
35
-
36
-
37
-
38
-
39
-
40
-
41
-
42
-
43
-
44
-
45
-
46
-
47
-
48
-
49
-
50
-
51
-
52
-
53
-
54
-
55
-
56
-
57
-
58
-
59
-
60
-
61
-
62
-
63
-
64
-
65
-
66
-
67
-
68
-
69
-
70
-
71
-
72
-
73
-
74
-
75
-
76
-
77
-
78
-
79
-
80
-
81
-
82
-
83
-
84
-
85
-
86
-
87
-
88
-
89
-
90
-
91
-
92
-
93
-
94
-
95
-
96
-
97
-
98
-
99
-
100
-
101
-
 102
102 -
 103
103 -
 104
104 -
 105
105 -
 106
106 -
 107
107 -
 108
108 -
 109
109 -
 110
110 -
 111
111 -
 112
112 -
 113
113 -
 114
114 -
 115
115 -
 116
116 -
 117
117 -
 118
118 -
 119
119 -
 120
120 -
 121
121 -
 122
122 -
123
-
124
-
125
-
126
-
127
-
128
-
129
-
130
-
131
-
132
-
133
-
134
-
135
-
136
-
137
-
138
-
139
-
140
-
141
-
142
-
143
-
144
-
145
-
146
-
147
-
148
-
149
-
150
-
151
-
152
-
153
-
154
-
155
-
156
-
157
-
158
-
159
 |
 |

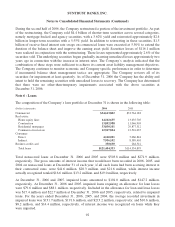
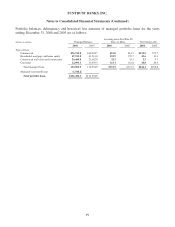
SUNTRUST BANKS, INC.
Notes to Consolidated Financial Statements (Continued)
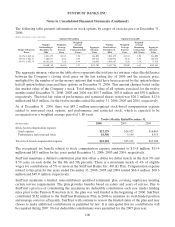
Portfolio balances, delinquency and historical loss amounts of managed portfolio loans for the years
ending December 31, 2006 and 2005 are as follows:
(Dollars in millions) Principal Balance
Accruing loans Past Due 90
Days or More Net Charge-offs
2006 2005 2006 2005 2006 2005
Type of loan:
Commercial $36,512.8 $34,028.7 $13.0 $14.7 $153.5 $75.7
Residential mortgage and home equity 47,932.8 43,513.0 192.9 159.7 43.6 33.0
Commercial real estate and construction 26,460.8 23,562.9 32.5 35.3 2.2 5.7
Consumer 12,096.1 13,450.3 113.1 161.8 46.8 84.4
Total managed loans 123,002.5 114,554.9 $351.5 $371.5 $246.1 $198.8
Managed securitized loans (1,548.2) -
Total portfolio loans $121,454.3 $114,554.9
99