SunTrust 2006 Annual Report Download - page 142
Download and view the complete annual report
Please find page 142 of the 2006 SunTrust annual report below. You can navigate through the pages in the report by either clicking on the pages listed below, or by using the keyword search tool below to find specific information within the annual report.-
 1
1 -
2
-
3
-
4
-
5
-
6
-
7
-
8
-
9
-
10
-
11
-
12
-
13
-
14
-
15
-
16
-
17
-
18
-
19
-
20
-
21
-
22
-
23
-
24
-
25
-
26
-
27
-
28
-
29
-
30
-
31
-
32
-
33
-
34
-
35
-
36
-
37
-
38
-
39
-
40
-
41
-
42
-
43
-
44
-
45
-
46
-
47
-
48
-
49
-
50
-
51
-
52
-
53
-
54
-
55
-
56
-
57
-
58
-
59
-
60
-
61
-
62
-
63
-
64
-
65
-
66
-
67
-
68
-
69
-
70
-
71
-
72
-
73
-
74
-
75
-
76
-
77
-
78
-
79
-
80
-
81
-
82
-
83
-
84
-
85
-
86
-
87
-
88
-
89
-
90
-
91
-
92
-
93
-
94
-
95
-
96
-
97
-
98
-
99
-
100
-
101
-
102
-
103
-
104
-
105
-
106
-
107
-
108
-
109
-
110
-
111
-
112
-
113
-
114
-
115
-
116
-
117
-
118
-
119
-
120
-
121
-
122
-
123
-
124
-
125
-
126
-
127
-
128
-
129
-
130
-
131
-
 132
132 -
 133
133 -
 134
134 -
 135
135 -
 136
136 -
 137
137 -
 138
138 -
 139
139 -
 140
140 -
 141
141 -
 142
142 -
 143
143 -
 144
144 -
 145
145 -
 146
146 -
 147
147 -
 148
148 -
 149
149 -
 150
150 -
 151
151 -
 152
152 -
153
-
154
-
155
-
156
-
157
-
158
-
159
 |
 |

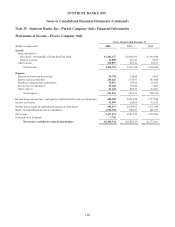
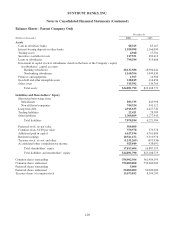
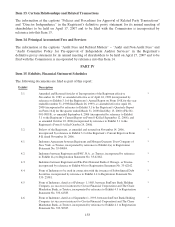
SUNTRUST BANKS, INC.
Notes to Consolidated Financial Statements (Continued)
Balance Sheets - Parent Company Only
December 31
(Dollars in thousands) 2006 2005
Assets
Cash in subsidiary banks $8,315 $5,167
Interest-bearing deposits in other banks 1,930,998 1,166,090
Trading assets 4,948 17,701
Securities available for sale 217,551 383,613
Loans to subsidiaries 790,294 913,666
Investment in capital stock of subsidiaries stated on the basis of the Company’s equity
in subsidiaries’ capital accounts:
Banking subsidiaries 20,132,580 18,906,644
Nonbanking subsidiaries 1,160,766 1,049,630
Premises and equipment 1,927 14,908
Goodwill and other intangible assets 128,819 116,656
Other assets 515,592 534,704
Total assets $24,891,790 $23,108,779
Liabilities and Shareholders’ Equity
Short-term borrowings from:
Subsidiaries $93,735 $45,998
Non-affiliated companies 744,524 441,112
Long-term debt 4,916,635 4,427,740
Trading liabilities 22,421 28,589
Other liabilities 1,300,869 1,277,945
Total liabilities 7,078,184 6,221,384
Preferred stock, no par value 500,000 -
Common stock, $1.00 par value 370,578 370,578
Additional paid in capital 6,627,196 6,761,684
Retained earnings 10,541,152 9,310,978
Treasury stock, at cost, and other (1,151,269) (493,936)
Accumulated other comprehensive income 925,949 938,091
Total shareholders’ equity 17,813,606 16,887,395
Total liabilities and shareholders’ equity $24,891,790 $23,108,779
Common shares outstanding 354,902,566 361,984,193
Common shares authorized 750,000,000 750,000,000
Preferred shares outstanding 5,000 -
Preferred shares authorized 50,000,000 50,000,000
Treasury shares of common stock 15,675,832 8,594,205
129