SunTrust 2006 Annual Report Download - page 38
Download and view the complete annual report
Please find page 38 of the 2006 SunTrust annual report below. You can navigate through the pages in the report by either clicking on the pages listed below, or by using the keyword search tool below to find specific information within the annual report.-
 1
1 -
2
-
3
-
4
-
5
-
6
-
7
-
8
-
9
-
10
-
11
-
12
-
13
-
14
-
15
-
16
-
17
-
18
-
19
-
20
-
21
-
22
-
23
-
24
-
25
-
26
-
27
-
 28
28 -
 29
29 -
 30
30 -
 31
31 -
 32
32 -
 33
33 -
 34
34 -
 35
35 -
 36
36 -
 37
37 -
 38
38 -
 39
39 -
 40
40 -
 41
41 -
 42
42 -
 43
43 -
 44
44 -
 45
45 -
 46
46 -
 47
47 -
 48
48 -
49
-
50
-
51
-
52
-
53
-
54
-
55
-
56
-
57
-
58
-
59
-
60
-
61
-
62
-
63
-
64
-
65
-
66
-
67
-
68
-
69
-
70
-
71
-
72
-
73
-
74
-
75
-
76
-
77
-
78
-
79
-
80
-
81
-
82
-
83
-
84
-
85
-
86
-
87
-
88
-
89
-
90
-
91
-
92
-
93
-
94
-
95
-
96
-
97
-
98
-
99
-
100
-
101
-
102
-
103
-
104
-
105
-
106
-
107
-
108
-
109
-
110
-
111
-
112
-
113
-
114
-
115
-
116
-
117
-
118
-
119
-
120
-
121
-
122
-
123
-
124
-
125
-
126
-
127
-
128
-
129
-
130
-
131
-
132
-
133
-
134
-
135
-
136
-
137
-
138
-
139
-
140
-
141
-
142
-
143
-
144
-
145
-
146
-
147
-
148
-
149
-
150
-
151
-
152
-
153
-
154
-
155
-
156
-
157
-
158
-
159
 |
 |

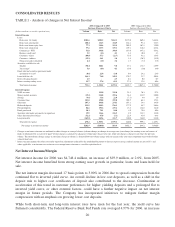
syndication businesses. Trading account profits and commissions declined $32.1 million, or 22.1%,
primarily due to negative interest rate related marks on securitization residuals and economic hedges
outside of the Corporate and Investment Banking line of business. Trading activities in the CIB line of
business represented only a third of the overall decline, primarily due to a decline in fixed income sales
and trading resulting from the flat to inverted yield curve experienced throughout 2006.
Trust and investment management income increased $13.2 million, or 2.0%, compared to 2005. An
overall increase in assets under management and improved market conditions resulted in higher income.
Assets under management increased 4.3% compared to December 31, 2005 due to net new business and
an increase in equity market valuations. Trust and investment management income and assets under
management were impacted by the sale of the Bond Trustee business in the third quarter of 2006.
Approximately $21 billion in non-managed corporate trust assets were transferred to U.S. Bank in the
third quarter. For the first nine months of 2006, prior to the sale, the Bond Trustee business generated
approximately $17 million of revenue, a majority of which was classified as trust and investment
management income. The sale of the business, which generated a pre-tax gain of $112.8 million, was
part of an effort by the Company to modify its business mix by focusing on its high-growth core
business lines and market segments.
Other noninterest income increased $65.5 million or 24.8% primarily as a result of gains recognized on
the sale/securitization of student loans, higher Affordable Housing revenue, and higher revenue related
to structured transactions. Net securities losses increased $43.3 million compared to 2005 driven by
$116.1 million of securities losses incurred in 2006 as a result of restructuring the securities portfolio.
These losses were partially offset by gains realized on equity positions sold by the Company in 2006.
Further discussion of the bond portfolio restructuring is provided in the “Securities Available for Sale”
section of Management’s Discussion and Analysis.
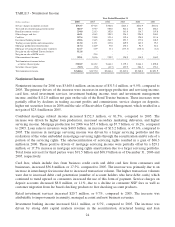
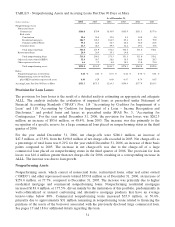
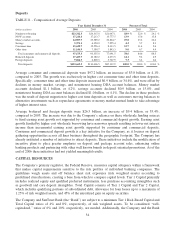
TABLE 4 - Noninterest Expense
Twelve Months Ended December 31,
(Dollars in millions) 2006 2005 2004 2003 2002 2001
Employee compensation $2,253.5 $2,117.2 $1,804.9 $1,585.9 $1,512.1 $1,484.5
Employee benefits 471.9 417.1 363.4 358.6 306.4 193.0
Total personnel expense 2,725.4 2,534.3 2,168.3 1,944.5 1,818.5 1,677.5
Net occupancy expense 334.2 312.1 268.2 237.3 229.3 210.4
Outside processing and software 393.6 357.4 286.3 246.7 225.2 199.1
Equipment expense 197.0 204.0 184.9 178.4 174.8 189.8
Marketing and customer development 173.2 156.7 128.3 100.3 80.0 104.0
Consulting and legal 113.0 112.6 81.0 57.4 91.1 87.7
Amortization of intangible assets 103.2 119.0 77.6 64.5 58.9 46.3
Credit and collection services 101.6 84.9 66.7 70.3 64.6 74.6
Postage and delivery 92.7 85.4 69.8 69.0 69.4 64.0
Other staff expense 92.5 90.1 66.0 60.4 52.0 58.5
Communications 72.9 79.2 67.2 61.3 64.8 59.2
Operating supplies 54.0 53.2 46.8 39.8 46.8 48.3
FDIC premiums 22.6 23.1 19.5 18.0 17.4 16.0
Merger expense -98.6 28.4 - 16.0 -
Other real estate expense/(income) 0.2 (1.2) (1.8) (2.0) (0.1) (4.2)
Loss on extinguishment of debt 11.7 -----
Other expense 392.1 381.3 339.8 254.7 210.7 168.7
Total noninterest expense $4,879.9 $4,690.7 $3,897.0 $3,400.6 $3,219.4 $2,999.9
Year-over-year growth rate 4.0 % 20.4 % 14.6 % 5.6 % 7.3 % 6.1 %
Efficiency ratio 59.4 60.1 61.4 60.0 58.0 56.1
Noninterest Expense
Noninterest expense increased $189.2 million, or 4.0%, compared to 2005. The increase was driven by a
$191.1 million, or 7.5%, increase in total personnel expense. The increase was primarily due to merit
25