SunTrust 2006 Annual Report Download - page 139
Download and view the complete annual report
Please find page 139 of the 2006 SunTrust annual report below. You can navigate through the pages in the report by either clicking on the pages listed below, or by using the keyword search tool below to find specific information within the annual report.-
 1
1 -
2
-
3
-
4
-
5
-
6
-
7
-
8
-
9
-
10
-
11
-
12
-
13
-
14
-
15
-
16
-
17
-
18
-
19
-
20
-
21
-
22
-
23
-
24
-
25
-
26
-
27
-
28
-
29
-
30
-
31
-
32
-
33
-
34
-
35
-
36
-
37
-
38
-
39
-
40
-
41
-
42
-
43
-
44
-
45
-
46
-
47
-
48
-
49
-
50
-
51
-
52
-
53
-
54
-
55
-
56
-
57
-
58
-
59
-
60
-
61
-
62
-
63
-
64
-
65
-
66
-
67
-
68
-
69
-
70
-
71
-
72
-
73
-
74
-
75
-
76
-
77
-
78
-
79
-
80
-
81
-
82
-
83
-
84
-
85
-
86
-
87
-
88
-
89
-
90
-
91
-
92
-
93
-
94
-
95
-
96
-
97
-
98
-
99
-
100
-
101
-
102
-
103
-
104
-
105
-
106
-
107
-
108
-
109
-
110
-
111
-
112
-
113
-
114
-
115
-
116
-
117
-
118
-
119
-
120
-
121
-
122
-
123
-
124
-
125
-
126
-
127
-
128
-
 129
129 -
 130
130 -
 131
131 -
 132
132 -
 133
133 -
 134
134 -
 135
135 -
 136
136 -
 137
137 -
 138
138 -
 139
139 -
 140
140 -
 141
141 -
 142
142 -
 143
143 -
 144
144 -
 145
145 -
 146
146 -
 147
147 -
 148
148 -
 149
149 -
150
-
151
-
152
-
153
-
154
-
155
-
156
-
157
-
158
-
159
 |
 |

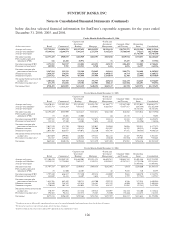
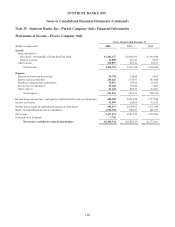
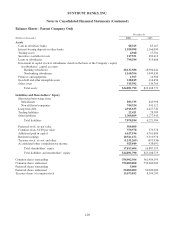
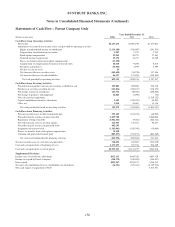
SUNTRUST BANKS, INC.
Notes to Consolidated Financial Statements (Continued)
below disclose selected financial information for SunTrust’s reportable segments for the years ended
December 31, 2006, 2005, and 2004.
Twelve Months Ended December 31, 2006
(Dollars in thousands) Retail Commercial
Corporate and
Investment
Banking Mortgage
Wealth and
Investment
Management
Corporate Other
and Treasury
Reconciling
Items Consolidated
Average total assets $37,795,826 $34,856,520 $23,967,653 $42,014,951 $8,936,418 $30,712,272 $2,031,506 $180,315,146
Average total liabilities 69,140,616 14,244,954 7,901,335 2,151,556 9,615,218 59,788,844 (74,117) 162,768,406
Average total equity - - - - - - 17,546,740 17,546,740
Net interest income $2,373,435 $900,519 $202,909 $603,393 $367,088 ($119,932) $333,053 $4,660,465
Fully taxable-equivalent
adjustment (FTE) 116 41,418 30,972 - 71 15,437 (48) 87,966
Net interest income (FTE)12,373,551 941,937 233,881 603,393 367,159 (104,495) 333,005 4,748,431
Provision for loan losses2105,985 9,701 113,933 8,748 3,696 4,076 16,397 262,536
Net interest income after
provision for loan losses 2,267,566 932,236 119,948 594,645 363,463 (108,571) 316,608 4,485,895
Noninterest income 1,050,187 279,059 670,036 379,424 1,098,855 16,714 (25,903) 3,468,372
Noninterest expense 2,133,912 645,506 457,464 597,694 1,036,864 32,380 (23,960) 4,879,860
Net income before provision for
income taxes 1,183,841 565,789 332,520 376,375 425,454 (124,237) 314,665 3,074,407
Provision for income taxes3433,370 132,890 119,381 127,983 158,127 (121,508) 106,693 956,936
Net income/(loss) $750,471 $432,899 $213,139 $248,392 $267,327 ($2,729) $207,972 $2,117,471
Twelve Months Ended December 31, 2005
Retail Commercial
Corporate and
Investment
Banking Mortgage
Wealth and
Investment
Management
Corporate Other
and Treasury
Reconciling
Items Consolidated
Average total assets $36,870,411 $32,992,104 $21,259,491 $33,031,791 $8,565,773 $32,847,160 $2,522,041 $168,088,771
Average total liabilities 65,355,783 13,814,293 7,693,415 1,870,981 9,665,589 53,357,817 (195,389) 151,562,489
Average total equity - - - - - - 16,526,282 16,526,282
Net interest income $2,195,449 $858,909 $243,417 $547,671 $342,820 $16,686 $374,014 $4,578,966
Fully taxable-equivalent
adjustment (FTE) 83 38,201 22,005 - 64 15,138 1 75,492
Net interest income (FTE)12,195,532 897,110 265,422 547,671 342,884 31,824 374,015 4,654,458
Provision for loan losses2138,322 25,360 14,808 5,614 8,880 5,798 (21,896) 176,886
Net interest income after
provision for loan losses 2,057,210 871,750 250,614 542,057 334,004 26,026 395,911 4,477,572
Noninterest income 1,023,384 255,128 639,525 239,300 943,987 84,252 (30,532) 3,155,044
Noninterest expense 2,053,505 626,977 454,072 522,120 976,748 87,851 (30,544) 4,690,729
Net income before provision for
income taxes 1,027,089 499,901 436,067 259,237 301,243 22,427 395,923 2,941,887
Provision for income taxes3381,827 119,025 165,225 87,378 114,040 (52,554) 139,707 954,648
Net income $645,262 $380,876 $270,842 $171,859 $187,203 $74,981 $256,216 $1,987,239
Twelve Months Ended December 31, 2004
Retail Commercial
Corporate and
Investment
Banking Mortgage
Wealth and
Investment
Management
Corporate Other
and Treasury
Reconciling
Items Consolidated
Average total assets $27,308,870 $24,949,749 $18,668,903 $23,921,125 $6,658,742 $30,645,318 $1,601,586 $133,754,293
Average total liabilities 53,259,535 11,724,004 7,667,517 1,549,213 8,015,849 41,247,813 (1,179,120) 122,284,811
Average total equity - - - - - - 11,469,482 11,469,482
Net interest income $1,797,735 $655,387 $240,913 $489,314 $242,961 ($815) $259,660 $3,685,155
Fully taxable-equivalent
adjustment (FTE) 75 31,500 16,207 - 48 9,858 710 58,398
Net interest income (FTE)11,797,810 686,887 257,120 489,314 243,009 9,043 260,370 3,743,553
Provision for loan losses2142,049 24,438 16,407 3,614 3,780 2,797 (57,548) 135,537
Net interest income after
provision for loan losses 1,655,761 662,449 240,713 485,700 239,229 6,246 317,918 3,608,016
Noninterest income 834,680 236,389 632,618 116,363 821,155 (6,600) (30,159) 2,604,446
Noninterest expense 1,720,044 505,744 456,095 372,248 826,287 53,961 (37,341) 3,897,038
Net income before provision for
income taxes 770,397 393,094 417,236 229,815 234,097 (54,315) 325,100 2,315,424
Provision for income taxes3294,563 96,284 157,873 78,267 81,500 (78,442) 112,478 742,523
Net income $475,834 $296,810 $259,363 $151,548 $152,597 $24,127 $212,622 $1,572,901
1Net interest income is fully taxable equivalent and is presented on a matched maturity funds transfer price basis for the lines of business.
2Provision for loan losses represents net charge-offs for the lines of business.
3Includes regular income tax provision and taxable-equivalent income adjustment reversal.
126