SunTrust 2006 Annual Report Download - page 123
Download and view the complete annual report
Please find page 123 of the 2006 SunTrust annual report below. You can navigate through the pages in the report by either clicking on the pages listed below, or by using the keyword search tool below to find specific information within the annual report.-
 1
1 -
2
-
3
-
4
-
5
-
6
-
7
-
8
-
9
-
10
-
11
-
12
-
13
-
14
-
15
-
16
-
17
-
18
-
19
-
20
-
21
-
22
-
23
-
24
-
25
-
26
-
27
-
28
-
29
-
30
-
31
-
32
-
33
-
34
-
35
-
36
-
37
-
38
-
39
-
40
-
41
-
42
-
43
-
44
-
45
-
46
-
47
-
48
-
49
-
50
-
51
-
52
-
53
-
54
-
55
-
56
-
57
-
58
-
59
-
60
-
61
-
62
-
63
-
64
-
65
-
66
-
67
-
68
-
69
-
70
-
71
-
72
-
73
-
74
-
75
-
76
-
77
-
78
-
79
-
80
-
81
-
82
-
83
-
84
-
85
-
86
-
87
-
88
-
89
-
90
-
91
-
92
-
93
-
94
-
95
-
96
-
97
-
98
-
99
-
100
-
101
-
102
-
103
-
104
-
105
-
106
-
107
-
108
-
109
-
110
-
111
-
112
-
 113
113 -
 114
114 -
 115
115 -
 116
116 -
 117
117 -
 118
118 -
 119
119 -
 120
120 -
 121
121 -
 122
122 -
 123
123 -
 124
124 -
 125
125 -
 126
126 -
 127
127 -
 128
128 -
 129
129 -
 130
130 -
 131
131 -
 132
132 -
 133
133 -
134
-
135
-
136
-
137
-
138
-
139
-
140
-
141
-
142
-
143
-
144
-
145
-
146
-
147
-
148
-
149
-
150
-
151
-
152
-
153
-
154
-
155
-
156
-
157
-
158
-
159
 |
 |

SUNTRUST BANKS, INC.
Notes to Consolidated Financial Statements (Continued)
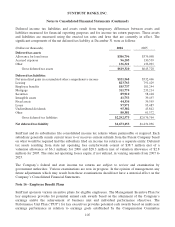
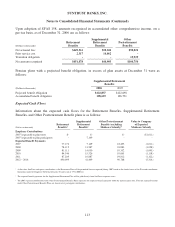
A rate of compensation growth is used to determine future benefit obligations for those plans whose
benefits vary by pay. Based on a 2005 study of recent SunTrust salary increase experience and
projections of real inflation, wage growth, and merit increases, SunTrust increased its compensation
increase assumption from 4.0% to 4.5% from year end 2004 to year end 2005. The assumption remained
unchanged for year-end 2006.
Actuarial gains and losses are created when actual experience deviates from assumptions. The actuarial
gains and losses for 2006 resulted from higher discount rates, offset by slightly higher than expected
retiree health care claims experience for the postretirement welfare plan, higher than expected salary
increases for the retirement plans, and participant data changes for all plans.
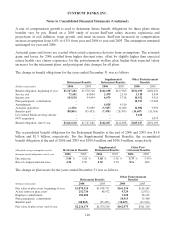
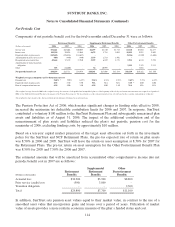
The change in benefit obligations for the years ended December 31 was as follows:
Retirement Benefits
Supplemental
Retirement Benefits
Other Postretirement
Benefits
(Dollars in thousands) 2006 2005 2006 2005 2006 2005
Benefit obligation, beginning of year $1,727,282 $1,570,728 $122,698 $127,969 $191,199 $182,291
Service cost 72,441 63,604 2,479 2,130 3,118 3,034
Interest cost 103,510 94,494 6,679 5,718 10,912 9,921
Plan participants’ contributions ----18,913 15,400
Amendments --4,028 4,510 --
Actuarial (gain)/loss (2,238) 93,889 (5,569) 11,080 16,982 9,390
Benefits paid (88,865) (95,433) (7,478) (28,709) (34,607) (31,916)
Less federal Medicare drug subsidy ----3,100 -
NCF acquisition -----3,079
Benefit obligation, end of year $1,812,130 $1,727,282 $122,837 $122,698 $209,617 $191,199
The accumulated benefit obligation for the Retirement Benefits at the end of 2006 and 2005 was $1.6
billion and $1.5 billion, respectively. For the Supplemental Retirement Benefits, the accumulated
benefit obligation at the end of 2006 and 2005 was $108.6 million and $106.8 million, respectively.
(Weighted average assumptions used to Retirement Benefits
Supplemental
Retirement Benefits
Other Post-
retirement Benefits
determine benefit obligations, end of year) 2006 2005 2006 2005 2006 2005
Discount rate 5.94 % 5.68 % 5.68 % 5.56 % 5.75 % 5.45%
Rate of compensation increase 4.50 4.50 4.50 4.50 N/A N/A
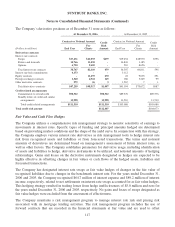
The change in plan assets for the years ended December 31 was as follows:
Retirement Benefits
Other Postretirement
Benefits
(Dollars in thousands) 2006 2005 2006 2005
Fair value of plan assets, beginning of year $1,870,310 $1,878,771 $161,310 $154,565
Actual return on plan assets 252,734 86,972 9,729 (2,871)
Employer contributions 182,000 -7,628 26,132
Plan participants’ contributions --18,913 15,400
Benefits paid (88,865) (95,433) (34,607) (31,916)
Fair value of plan assets, end of year $2,216,179 $1,870,310 $162,973 $161,310
110