SunTrust 2006 Annual Report Download - page 39
Download and view the complete annual report
Please find page 39 of the 2006 SunTrust annual report below. You can navigate through the pages in the report by either clicking on the pages listed below, or by using the keyword search tool below to find specific information within the annual report.-
 1
1 -
2
-
3
-
4
-
5
-
6
-
7
-
8
-
9
-
10
-
11
-
12
-
13
-
14
-
15
-
16
-
17
-
18
-
19
-
20
-
21
-
22
-
23
-
24
-
25
-
26
-
27
-
28
-
 29
29 -
 30
30 -
 31
31 -
 32
32 -
 33
33 -
 34
34 -
 35
35 -
 36
36 -
 37
37 -
 38
38 -
 39
39 -
 40
40 -
 41
41 -
 42
42 -
 43
43 -
 44
44 -
 45
45 -
 46
46 -
 47
47 -
 48
48 -
 49
49 -
50
-
51
-
52
-
53
-
54
-
55
-
56
-
57
-
58
-
59
-
60
-
61
-
62
-
63
-
64
-
65
-
66
-
67
-
68
-
69
-
70
-
71
-
72
-
73
-
74
-
75
-
76
-
77
-
78
-
79
-
80
-
81
-
82
-
83
-
84
-
85
-
86
-
87
-
88
-
89
-
90
-
91
-
92
-
93
-
94
-
95
-
96
-
97
-
98
-
99
-
100
-
101
-
102
-
103
-
104
-
105
-
106
-
107
-
108
-
109
-
110
-
111
-
112
-
113
-
114
-
115
-
116
-
117
-
118
-
119
-
120
-
121
-
122
-
123
-
124
-
125
-
126
-
127
-
128
-
129
-
130
-
131
-
132
-
133
-
134
-
135
-
136
-
137
-
138
-
139
-
140
-
141
-
142
-
143
-
144
-
145
-
146
-
147
-
148
-
149
-
150
-
151
-
152
-
153
-
154
-
155
-
156
-
157
-
158
-
159
 |
 |

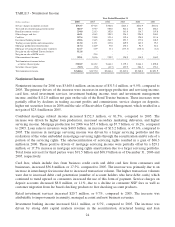
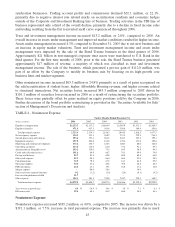
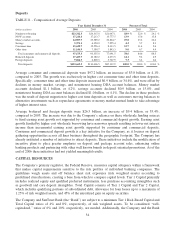
increases, contract programming, higher pension expense, and increased headcount, while revenue
based incentive costs were relatively flat. Headcount increased 887 full time equivalent positions from
December 31, 2005 to September 30, 2006, however, declined 694 positions from September 30, 2006
to December 31, 2006. This 2.0% decline in total headcount in the fourth quarter is an example of
positive results from cost savings initiatives implemented in the second half of 2006.
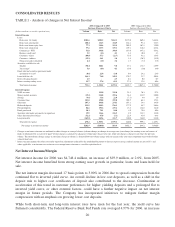
Net occupancy expense increased $22.1 million, or 7.1%, compared to 2005. The increase was driven by
higher rent related to new offices and branches, as the Company continues to invest in the retail
distribution network, higher leasehold improvements, and utility costs. Outside processing and software
increased $36.2 million, or 10.1%, compared to 2005 due to higher processing costs associated with
higher transaction volumes and higher software maintenance costs.
Marketing and customer development expense increased $16.5 million, or 10.5%, primarily due to the
Company’s marketing campaigns focused on customer acquisition and deposit promotion. Amortization
of intangible assets decreased $15.8 million, or 13.3%, compared to 2005 due to lower core deposit
intangible amortization.
Noninterest expense was further impacted by a $16.7 million, or 19.7%, increase in credit and collection
services primarily due to higher loan closing costs from increased volumes. The Company incurred a
loss on extinguishment of debt of $11.7 million in 2006 as part of its capital restructuring initiative.
Merger expense of $98.6 million was incurred in 2005 related to the NCF integration process.
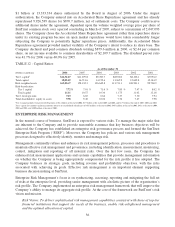
In January 2007, the Company announced an efficiency and productivity program that emphasizes an
increased focus on sustainable efficiency and productivity improvements. The Company anticipates cost
savings of $400 million by the end of 2009 through initiatives identified in corporate real estate, supplier
management, off-shoring, and process/organizational reviews. The $400 million of anticipated cost
savings does not include the cost of incremental investments for these initiatives.
Provision for Income Taxes
The provision for income taxes includes both federal and state income taxes. In 2006, the provision was
$869.0 million, compared to $879.2 million in 2005. The provision represents an effective tax rate of
29.1% for 2006 compared to 30.7% for 2005. The decrease in the effective tax rate was primarily
attributable to an adjustment to the Company’s state income tax liabilities based on the filing of its 2005
income tax returns and the resolution of certain tax positions.
TABLE 5 - Loan Portfolio by Types of Loans
As of December 31
(Dollars in millions) 2006 2005 2004 2003 2002 2001
Commercial $34,613.9 $33,764.2 $31,823.8 $30,681.9 $28,693.6 $28,945.9
Real estate:
Home equity lines 14,102.7 13,635.7 11,519.2 6,965.3 5,194.8 2,776.7
Construction 13,893.0 11,046.9 7,845.4 4,479.8 4,002.4 3,627.3
Residential mortgages 33,830.1 29,877.3 24,553.5 17,208.1 14,248.6 14,520.4
Commercial real estate 12,567.8 12,516.0 12,083.8 9,330.1 9,101.8 8,152.0
Consumer:
Direct 4,160.1 5,060.8 6,622.3 3,539.6 3,991.3 4,378.1
Indirect 7,936.0 8,389.5 6,802.9 8,394.5 7,824.1 6,466.8
Business credit card 350.7 264.5 175.3 133.0 111.3 92.0
Total loans $121,454.3 $114,554.9 $101,426.2 $80,732.3 $73,167.9 $68,959.2
Loans held for sale $11,790.1 $13,695.6 $6,580.2 $5,552.1 $7,747.8 $4,319.6
26