SunTrust 2006 Annual Report Download - page 27
Download and view the complete annual report
Please find page 27 of the 2006 SunTrust annual report below. You can navigate through the pages in the report by either clicking on the pages listed below, or by using the keyword search tool below to find specific information within the annual report.-
 1
1 -
2
-
3
-
4
-
5
-
6
-
7
-
8
-
9
-
10
-
11
-
12
-
13
-
14
-
15
-
16
-
 17
17 -
 18
18 -
 19
19 -
 20
20 -
 21
21 -
 22
22 -
 23
23 -
 24
24 -
 25
25 -
 26
26 -
 27
27 -
 28
28 -
 29
29 -
 30
30 -
 31
31 -
 32
32 -
 33
33 -
 34
34 -
 35
35 -
 36
36 -
 37
37 -
38
-
39
-
40
-
41
-
42
-
43
-
44
-
45
-
46
-
47
-
48
-
49
-
50
-
51
-
52
-
53
-
54
-
55
-
56
-
57
-
58
-
59
-
60
-
61
-
62
-
63
-
64
-
65
-
66
-
67
-
68
-
69
-
70
-
71
-
72
-
73
-
74
-
75
-
76
-
77
-
78
-
79
-
80
-
81
-
82
-
83
-
84
-
85
-
86
-
87
-
88
-
89
-
90
-
91
-
92
-
93
-
94
-
95
-
96
-
97
-
98
-
99
-
100
-
101
-
102
-
103
-
104
-
105
-
106
-
107
-
108
-
109
-
110
-
111
-
112
-
113
-
114
-
115
-
116
-
117
-
118
-
119
-
120
-
121
-
122
-
123
-
124
-
125
-
126
-
127
-
128
-
129
-
130
-
131
-
132
-
133
-
134
-
135
-
136
-
137
-
138
-
139
-
140
-
141
-
142
-
143
-
144
-
145
-
146
-
147
-
148
-
149
-
150
-
151
-
152
-
153
-
154
-
155
-
156
-
157
-
158
-
159
 |
 |
PART II
Item 5. MARKET FOR REGISTRANT’S COMMON EQUITY AND RELATED
STOCKHOLDER MATTERS AND ISSUER PURCHASES OF EQUITY
SECURITIES
The principal market on which the Common Stock of the Company is traded is the New York Stock
Exchange (“NYSE”). See Item 6 and Table 16 in the MD&A for information on the high and the low
closing sales prices of the Common Stock on the NYSE, which is incorporated herein by reference.
During the twelve months ended December 31, 2006 and 2005, we paid a quarterly dividend of $.61 and
$.55 per share of Common Stock. Our Common Stock is held by approximately 38,328 Registered
Shareholders as of December 31, 2006. See Table 22 in the MD&A on page 69 for information on the
monthly share repurchases activity, including total common shares repurchased and announced
programs, weighted average per share price and the remaining buy-back authority under the announced
programs, which is incorporated herein by reference.
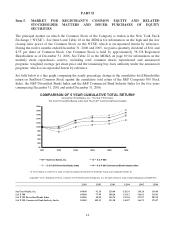
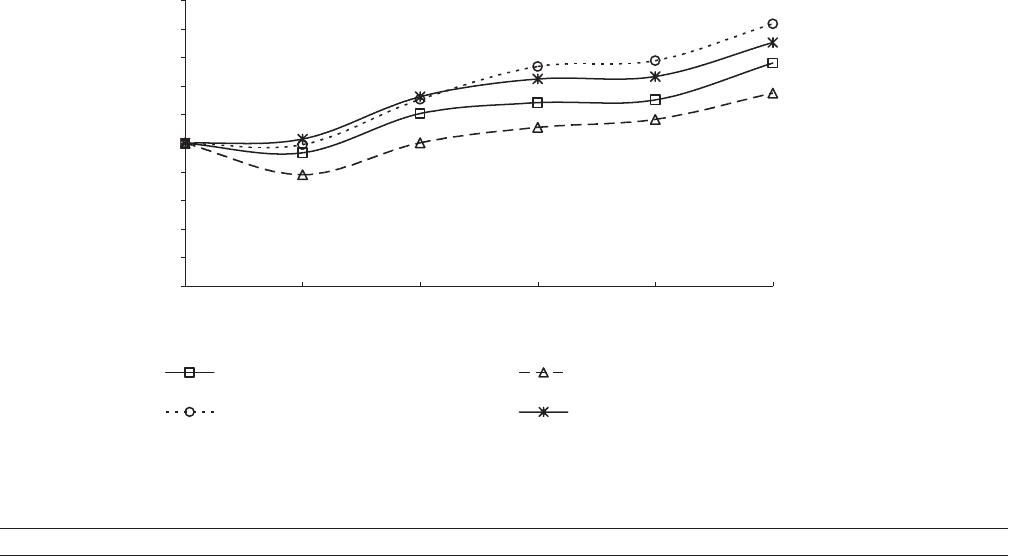
Set forth below is a line graph comparing the yearly percentage change in the cumulative total Shareholder
return on SunTrust Common Stock against the cumulative total return of the S&P Composite-500 Stock
Index, the S&P Diversified Banks Index and the S&P Commercial Bank Industry Index for the five years
commencing December 31, 2001 and ended December 31, 2006.
COMPARISON OF 5 YEAR CUMULATIVE TOTAL RETURN*
Among SunTrust Banks, Inc., The S & P 500 Index,
The S & P Diversified Banks Index And The S & P Commercial Bank Industry
$0
$20
$40
$60
$80
$100
$120
$140
$160
$180
$200
12/01 12/02 12/03 12/04 12/05 12/06
SunTrust Banks, Inc. S & P 500
S & P 500 Diversified Banks Index S & P 500 Commercial Bank Industry Index
* $ 100 invested on 12/31/01 in stock or index-including reinvestment of dividends. Fiscal year ending December 31.
Copyright ©2007, Standard & Poor's, a division of The McGraw-Hill Companies, Inc. All rights reserved. www.researchdatagroup.com/S&P.htm
12/01 12/02 12/03 12/04 12/05 12/06
SunTrust Banks, Inc. 100.00 93.26 120.64 128.31 130.24 156.04
S & P 500 100.00 77.90 100.24 111.15 116.61 135.03
S & P 500 Diversified Banks Index 100.00 98.98 130.74 153.64 157.87 183.59
S & P 500 Commercial Bank Industry Index 100.00 102.95 132.58 144.97 146.75 170.57
14