SunTrust 2006 Annual Report Download - page 69
Download and view the complete annual report
Please find page 69 of the 2006 SunTrust annual report below. You can navigate through the pages in the report by either clicking on the pages listed below, or by using the keyword search tool below to find specific information within the annual report.-
 1
1 -
2
-
3
-
4
-
5
-
6
-
7
-
8
-
9
-
10
-
11
-
12
-
13
-
14
-
15
-
16
-
17
-
18
-
19
-
20
-
21
-
22
-
23
-
24
-
25
-
26
-
27
-
28
-
29
-
30
-
31
-
32
-
33
-
34
-
35
-
36
-
37
-
38
-
39
-
40
-
41
-
42
-
43
-
44
-
45
-
46
-
47
-
48
-
49
-
50
-
51
-
52
-
53
-
54
-
55
-
56
-
57
-
58
-
 59
59 -
 60
60 -
 61
61 -
 62
62 -
 63
63 -
 64
64 -
 65
65 -
 66
66 -
 67
67 -
 68
68 -
 69
69 -
 70
70 -
 71
71 -
 72
72 -
 73
73 -
 74
74 -
 75
75 -
 76
76 -
 77
77 -
 78
78 -
 79
79 -
80
-
81
-
82
-
83
-
84
-
85
-
86
-
87
-
88
-
89
-
90
-
91
-
92
-
93
-
94
-
95
-
96
-
97
-
98
-
99
-
100
-
101
-
102
-
103
-
104
-
105
-
106
-
107
-
108
-
109
-
110
-
111
-
112
-
113
-
114
-
115
-
116
-
117
-
118
-
119
-
120
-
121
-
122
-
123
-
124
-
125
-
126
-
127
-
128
-
129
-
130
-
131
-
132
-
133
-
134
-
135
-
136
-
137
-
138
-
139
-
140
-
141
-
142
-
143
-
144
-
145
-
146
-
147
-
148
-
149
-
150
-
151
-
152
-
153
-
154
-
155
-
156
-
157
-
158
-
159
 |
 |
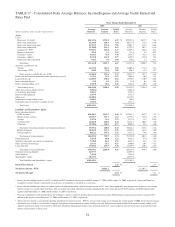
BUSINESS SEGMENTS RESULTS
Retail
Retail’s net income for the twelve months ended December 31, 2006 was $750.5 million, an increase of
$105.2 million, or 16.3%. The increase was primarily the result of loan and deposit growth, wider
deposit spreads, and lower provision for loan losses, partially offset by higher noninterest expense.
Fully taxable-equivalent net interest income increased $178.0 million, or 8.1%. The increase was
attributable to loan and deposit growth, a favorable change in the loan mix and wider deposit spreads.
Average loans increased $473.8 million, or 1.6%, primarily driven by growth in home equity products
offset by a decline in student loans due to sales and securitizations during 2006. Average deposits
increased $3.8 billion, or 5.8%, driven primarily by consumer time deposits. Deposit spreads widened
due to deposit rate increases that have been slower relative to market rate increases, as well as the
increasing value of lower cost deposits in a higher rate environment.
Provision for loan losses, which represents net charge-offs for the lines of business, decreased $32.3
million, or 23.4%, primarily due to a decline in consumer indirect auto net charge-offs.
Total noninterest income increased $26.8 million, or 2.6%. The increase was driven primarily by
interchange income due to increased volumes, as well as gains on student loan sales.
Total noninterest expense increased $80.4 million, or 3.9%. The increase was driven by increases in
interchange expense due to increased volume, as well as personnel and operations expense related to
investments in the branch distribution network and technology. Forty-four net new branches were added
during 2006.
Commercial
Commercial’s net income for the twelve months ended December 31, 2006 was $432.9 million, an
increase of $52.0 million, or 13.7%. The increase was primarily driven by net interest income and
noninterest income growth and lower provision for loan losses, partially offset by higher noninterest
expense.
Fully taxable-equivalent net interest income increased $44.8 million, or 5.0%. The increase was driven
by loan and deposit growth, as well as wider deposit spreads. Average loans increased $1.7 billion, or
5.5%, with the strongest growth in construction lending. Average deposits increased $378.5 million, or
2.8%, driven by an increase in institutional and government deposits and partially offset by decreases in
demand deposits and money market accounts. Deposit spreads increased due to the increasing value of
lower-cost deposits in a higher rate environment.
Provision for loan losses, which represents net charge-offs for the lines of business, decreased $15.7
million, or 61.7%. The decrease was driven primarily by lower net charge-offs in the Core Commercial
and the Real Estate Finance Group sub-lines of business.
Total noninterest income increased $23.9 million, or 9.4%. The increase resulted from higher
Affordable Housing revenues, deposit sweep income, as well as increased revenue from capital markets
and card products.
Total noninterest expense increased $18.5 million, or 3.0%. Increases in personnel and operations
expense were partially offset by a decrease in Affordable Housing expense.
56