SunTrust 2006 Annual Report Download - page 109
Download and view the complete annual report
Please find page 109 of the 2006 SunTrust annual report below. You can navigate through the pages in the report by either clicking on the pages listed below, or by using the keyword search tool below to find specific information within the annual report.-
 1
1 -
2
-
3
-
4
-
5
-
6
-
7
-
8
-
9
-
10
-
11
-
12
-
13
-
14
-
15
-
16
-
17
-
18
-
19
-
20
-
21
-
22
-
23
-
24
-
25
-
26
-
27
-
28
-
29
-
30
-
31
-
32
-
33
-
34
-
35
-
36
-
37
-
38
-
39
-
40
-
41
-
42
-
43
-
44
-
45
-
46
-
47
-
48
-
49
-
50
-
51
-
52
-
53
-
54
-
55
-
56
-
57
-
58
-
59
-
60
-
61
-
62
-
63
-
64
-
65
-
66
-
67
-
68
-
69
-
70
-
71
-
72
-
73
-
74
-
75
-
76
-
77
-
78
-
79
-
80
-
81
-
82
-
83
-
84
-
85
-
86
-
87
-
88
-
89
-
90
-
91
-
92
-
93
-
94
-
95
-
96
-
97
-
98
-
 99
99 -
 100
100 -
 101
101 -
 102
102 -
 103
103 -
 104
104 -
 105
105 -
 106
106 -
 107
107 -
 108
108 -
 109
109 -
 110
110 -
 111
111 -
 112
112 -
 113
113 -
 114
114 -
 115
115 -
 116
116 -
 117
117 -
 118
118 -
 119
119 -
120
-
121
-
122
-
123
-
124
-
125
-
126
-
127
-
128
-
129
-
130
-
131
-
132
-
133
-
134
-
135
-
136
-
137
-
138
-
139
-
140
-
141
-
142
-
143
-
144
-
145
-
146
-
147
-
148
-
149
-
150
-
151
-
152
-
153
-
154
-
155
-
156
-
157
-
158
-
159
 |
 |

SUNTRUST BANKS, INC.
Notes to Consolidated Financial Statements (Continued)
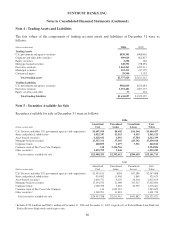
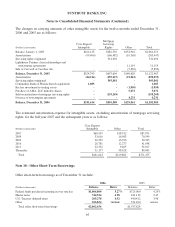
The average balances of short-term borrowings for the years ended December 31, 2006, 2005, and 2004
were $1.5 billion, $2.7 billion, and $1.7 billion, respectively, while the maximum amounts outstanding
at any month-end during the years ended December 31, 2006, 2005, and 2004 were $2.4 billion, $3.5
billion, and $4.0 billion, respectively.
Note 11 - Securitization Activity and Mortgage Servicing Rights
Mortgage-related Securitizations
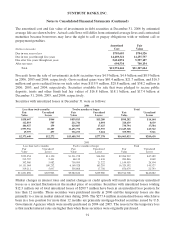
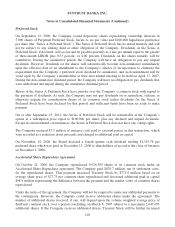
In May 2006, the Company sold residential mortgage loans in a securitization transaction in exchange
for net proceeds of $496.5 million and retained interests of $1.1 million in the form of interest only
strips and principal only strips. The Company continues to perform servicing for the underlying
mortgage loans. Servicing assets of approximately $9 million were recorded as a result of the
transaction. A pre-tax gain of $1.1 million was also recognized as a result of the transaction. The key
assumptions used in measuring the fair value of the retained interests at the time of the securitization are
current interest rates and prepayment speeds. Adverse changes in these key assumptions of 10% and
20% were analyzed, and the fair value sensitivity for each of these changes in aggregate totaled less than
$1 million. At December 31, 2006 and 2005, retained interests classified on the Consolidated Balance
Sheets as securities available for sale from mortgage loan securitizations were $209.3 million and
$288.4 million, respectively.
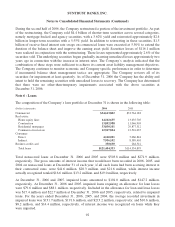
In March 2006, the Company securitized and sold $60.0 million of excess mortgage servicing rights in
exchange for net proceeds of $74.0 million and a retained interest of $10.4 million. A pre-tax gain of
$24.4 million was recognized as a result of the transaction. In December 2006, the Company sold its
retained interest in the securitization.
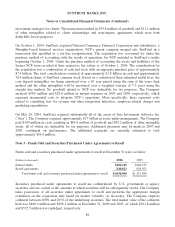
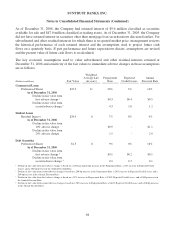
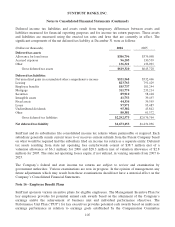
In addition to retained interests in securities, the Company may retain mortgage servicing rights from
the sale or securitization of residential mortgage loans. A summary of the key economic assumptions
used to measure total mortgage servicing rights and the sensitivity of the December 31, 2006 and 2005
fair values to immediate 10% and 20% adverse changes in those assumptions follows:
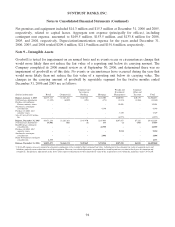
2006 2005
Prepayment rate (annual) 16.8% 13.3%
Weighted-average life (in years) 5.0 6.8
Discount rate 10.3% 10.0%
Weighted-average coupon 6.1 5.8
(Dollars in millions) 2006 2005
Fair value of retained mortgage servicing rights $1,110.7 $996.3
Prepayment rate assumption (annual) 16.8% 13.3%
Decline in fair value of 10% adverse change $44.5 $48.4
Decline in fair value of 20% adverse change 84.8 92.1
Residual cash flows discount rate (annual) 10.3% 10.0%
Decline in fair value of 10% adverse change $35.4 $32.7
Decline in fair value of 20% adverse change 68.6 63.4
The above sensitivities are hypothetical and should be used with caution. As the amounts indicate,
changes in fair value based on variations in assumptions generally cannot be extrapolated because the
relationship of the change in assumption to the change in fair value may not be linear. Also, in this table,
the effect of a variation in a particular assumption on the fair value of the retained interest is calculated
96