SunTrust 2006 Annual Report Download - page 36
Download and view the complete annual report
Please find page 36 of the 2006 SunTrust annual report below. You can navigate through the pages in the report by either clicking on the pages listed below, or by using the keyword search tool below to find specific information within the annual report.-
 1
1 -
2
-
3
-
4
-
5
-
6
-
7
-
8
-
9
-
10
-
11
-
12
-
13
-
14
-
15
-
16
-
17
-
18
-
19
-
20
-
21
-
22
-
23
-
24
-
25
-
 26
26 -
 27
27 -
 28
28 -
 29
29 -
 30
30 -
 31
31 -
 32
32 -
 33
33 -
 34
34 -
 35
35 -
 36
36 -
 37
37 -
 38
38 -
 39
39 -
 40
40 -
 41
41 -
 42
42 -
 43
43 -
 44
44 -
 45
45 -
 46
46 -
47
-
48
-
49
-
50
-
51
-
52
-
53
-
54
-
55
-
56
-
57
-
58
-
59
-
60
-
61
-
62
-
63
-
64
-
65
-
66
-
67
-
68
-
69
-
70
-
71
-
72
-
73
-
74
-
75
-
76
-
77
-
78
-
79
-
80
-
81
-
82
-
83
-
84
-
85
-
86
-
87
-
88
-
89
-
90
-
91
-
92
-
93
-
94
-
95
-
96
-
97
-
98
-
99
-
100
-
101
-
102
-
103
-
104
-
105
-
106
-
107
-
108
-
109
-
110
-
111
-
112
-
113
-
114
-
115
-
116
-
117
-
118
-
119
-
120
-
121
-
122
-
123
-
124
-
125
-
126
-
127
-
128
-
129
-
130
-
131
-
132
-
133
-
134
-
135
-
136
-
137
-
138
-
139
-
140
-
141
-
142
-
143
-
144
-
145
-
146
-
147
-
148
-
149
-
150
-
151
-
152
-
153
-
154
-
155
-
156
-
157
-
158
-
159
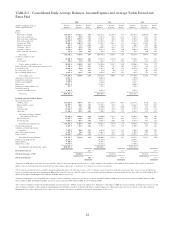
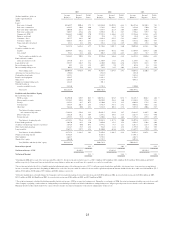
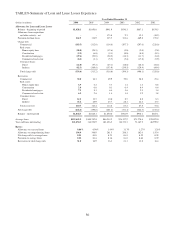
 |
 |

2003 2002 2001
(Dollars in millions; yields on
taxable-equivalentbasis)
Average
Balances
Income/
Expense
Yields/
Rates
Average
Balances
Income/
Expense
Yields/
Rates
Average
Balances
Income/
Expense
Yields
Rates
Assets
Loans:1
Real estate 1-4 family $15,689.7 $901.6 5.75 % $14,965.0 $1,029.8 6.88 % $16,173.6 $1,210.3 7.48 %
Real estate construction 4,149.5 190.9 4.60 3,749.3 203.5 5.43 3,632.0 270.0 7.43
Real estate home equity lines 6,098.0 267.3 4.38 4,193.7 212.9 5.08 2,400.7 190.8 7.95
Real estate commercial 9,203.7 454.6 4.94 8,705.8 511.1 5.87 7,796.4 579.9 7.44
Commercial - FTE228,616.2 1,060.2 3.70 27,522.5 1,196.4 4.35 29,126.6 1,833.1 6.29
Business credit card 129.7 9.0 6.91 97.6 7.4 7.65 81.0 6.8 8.44
Consumer - direct 3,675.7 186.2 5.07 4,382.4 255.5 5.83 4,448.7 331.9 7.46
Consumer - indirect 8,103.3 548.5 6.77 7,115.7 559.5 7.86 5,933.6 502.5 8.47
Nonaccrual and restructured 472.1 14.1 2.98 538.4 15.6 2.89 430.4 15.8 3.68
Total loans 76,137.9 3,632.4 4.77 71,270.4 3,991.7 5.60 70,023.0 4,941.1 7.06
Securities available for sale:
Taxable 20,994.4 676.2 3.22 16,890.3 818.6 4.85 15,904.8 1,033.9 6.50
Tax-exempt2374.1 24.1 6.46 408.3 28.0 6.85 448.7 35.7 7.95
Total securities available for sale 21,368.5 700.3 3.28 17,298.6 846.6 4.89 16,353.5 1,069.6 6.54
Funds sold and securities
under agreements to resell 1,387.0 15.7 1.13 1,390.4 24.5 1.76 1,250.3 51.2 4.09
Loans held for sale 8,587.7 448.3 5.22 4,410.8 280.4 6.36 2,949.9 211.5 7.17
Interest-bearing deposits 10.5 0.1 1.39 404.7 7.0 1.73 167.6 5.8 3.43
Interest earning trading assets 603.3 17.0 2.81 794.8 24.5 3.09 1,289.8 41.3 3.20
Total earning assets 108,094.9 4,813.8 4.45 95,569.7 5,174.7 5.41 92,034.1 6,320.5 6.87
Allowance for loan and lease losses (950.8) (924.3) (876.3)
Cash and due from banks 3,432.1 3,343.2 3,383.4
Premises and equipment 1,588.7 1,621.2 1,599.7
Other assets 6,655.0 5,373.4 4,043.3
Noninterest earning trading assets 1,162.5 801.1 -
Unrealized gains on
securities available for sale 2,343.0 2,731.8 2,700.0
Total assets $122,325.4 $108,516.1 $102,884.2
Liabilities and Shareholders’ Equity
Interest-bearing deposits:
NOW accounts $11,702.0 $50.7 0.43 % $10,315.4 $74.5 0.72 % $8,471.3 $101.2 1.20 %
Money market accounts 22,218.5 203.5 0.92 20,470.9 326.8 1.60 15,830.1 527.6 3.33
Savings 6,259.3 46.7 0.75 6,310.0 85.1 1.35 6,066.6 171.5 2.83
Consumer time 7,975.4 201.7 2.53 9,342.4 347.1 3.72 9,092.6 468.8 5.16
Other time 3,461.6 80.0 2.31 3,722.8 102.1 2.74 3,823.9 200.6 5.25
Total interest-bearing consumer
and commercial deposits 51,616.8 582.6 1.13 50,161.5 935.6 1.87 43,284.5 1,469.7 3.40
Brokered deposits 3,662.0 111.2 3.04 2,537.2 130.1 5.13 2,617.7 115.3 4.40
Foreign deposits 6,933.3 77.8 1.12 3,190.4 51.6 1.62 5,175.4 227.5 4.39
Total interest - bearing deposits 62,212.1 771.6 1.24 55,889.1 1,117.3 2.00 51,077.6 1,812.5 3.55
Federal funds purchased 6,025.0 66.2 1.10 3,902.0 62.2 1.59 4,768.5 190.8 4.00
Securities sold under agreements to repurchase 5,641.9 40.0 0.71 6,474.2 78.3 1.21 6,515.1 221.4 3.40
Other short-term borrowings 2,211.7 33.5 1.52 924.8 14.1 1.52 1,593.8 63.4 3.98
Long-term debt 12,657.1 537.2 4.24 11,960.0 619.6 5.18 12,497.2 739.0 5.91
Total interest - bearing liabilities 88,747.8 1,448.5 1.63 79,150.1 1,891.5 2.39 76,452.2 3,027.1 3.96
Noninterest-bearing deposits 17,826.9 15,268.1 13,491.1
Other liabilities 6,667.7 5,372.2 4,867.1
Shareholders’ equity 9,083.0 8,725.7 8,073.8
Total liabilities and shareholders’ equity $122,325.4 $108,516.1 $102,884.2
Interest Rate Spread 2.82 % 3.02 % 2.91 %
Net Interest Income - FTE3$3,365.3 $3,283.2 $3,293.4
Net Interest Margin43.11 % 3.44 % 3.58 %
1Beginning in 2006 and for each of the six years ended December 31, the interest income includes loan fees of $115.1 million, $123.6 million, $121.6 million, $123.8 million, $122.6 million, and $148.7
million, respectively. Nonaccrual loans are included in average balances and income on such loans, if recognized, is recorded on a cash basis.
2Interest income includes the effects of taxable-equivalent adjustments using a federal income tax rate of 35% for all years reported and where applicable, state income taxes, to increase tax-exempt interest
income to a taxable-equivalent basis. Beginning in 2006 and for each of the six years ended December 31, the net taxable-equivalent adjustment amounts included in the above table were $88.0 million, $75.5
million, $58.4 million, $45.0 million, $39.5 million, and $40.8 million, respectively.
3Derivative instruments used to help balance the Company’s interest-sensitivity position decreased net interest income by $105.6 million in 2006, increased net interest income by $104.4 million in 2005,
$151.5 million in 2004, $64.0 million in 2003, decreased net interest income $50.4 million in 2002, and $37.4 million in 2001.
4The net interest margin is calculated by dividing annualized net interest income – FTE by average total earning assets. During the second quarter of 2006, the net interest margin calculation was revised as a result
of the Company segregating certain noninterest earning trading assets that had previously been included with interest earning trading assets. All prior periods presented were restated to reflect this refinement.
Management believes this refined method to be a more reflective measure of net interest margin due to the interest earning nature of these assets.
23