SunTrust 2006 Annual Report Download - page 40
Download and view the complete annual report
Please find page 40 of the 2006 SunTrust annual report below. You can navigate through the pages in the report by either clicking on the pages listed below, or by using the keyword search tool below to find specific information within the annual report.-
 1
1 -
2
-
3
-
4
-
5
-
6
-
7
-
8
-
9
-
10
-
11
-
12
-
13
-
14
-
15
-
16
-
17
-
18
-
19
-
20
-
21
-
22
-
23
-
24
-
25
-
26
-
27
-
28
-
29
-
 30
30 -
 31
31 -
 32
32 -
 33
33 -
 34
34 -
 35
35 -
 36
36 -
 37
37 -
 38
38 -
 39
39 -
 40
40 -
 41
41 -
 42
42 -
 43
43 -
 44
44 -
 45
45 -
 46
46 -
 47
47 -
 48
48 -
 49
49 -
 50
50 -
51
-
52
-
53
-
54
-
55
-
56
-
57
-
58
-
59
-
60
-
61
-
62
-
63
-
64
-
65
-
66
-
67
-
68
-
69
-
70
-
71
-
72
-
73
-
74
-
75
-
76
-
77
-
78
-
79
-
80
-
81
-
82
-
83
-
84
-
85
-
86
-
87
-
88
-
89
-
90
-
91
-
92
-
93
-
94
-
95
-
96
-
97
-
98
-
99
-
100
-
101
-
102
-
103
-
104
-
105
-
106
-
107
-
108
-
109
-
110
-
111
-
112
-
113
-
114
-
115
-
116
-
117
-
118
-
119
-
120
-
121
-
122
-
123
-
124
-
125
-
126
-
127
-
128
-
129
-
130
-
131
-
132
-
133
-
134
-
135
-
136
-
137
-
138
-
139
-
140
-
141
-
142
-
143
-
144
-
145
-
146
-
147
-
148
-
149
-
150
-
151
-
152
-
153
-
154
-
155
-
156
-
157
-
158
-
159
 |
 |

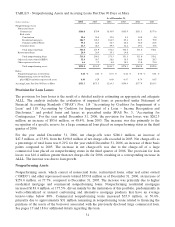
TABLE 6 - Funded Exposures by Selected Industries1
As of December 31, 2006 As of December 31, 2005
(Dollars in millions) Loans
% of Total
Loans Loans
% of Total
Loans
Construction $7,881.1 6.5 % $6,591.8 5.8 %
Real estate 6,782.7 5.6 5,890.4 5.1
Business services & nonprofits 6,132.1 5.0 4,545.3 4.0
Retail trade 5,050.6 4.2 4,551.0 4.0
Manufacturing 3,889.0 3.2 4,150.9 3.6
Wholesale trade 3,080.2 2.5 2,845.8 2.5
Health & social assistance 2,922.5 2.4 2,835.1 2.5
Finance & insurance 2,670.7 2.2 2,795.4 2.4
Professional, scientific & technical services 1,958.9 1.6 2,123.5 1.9
Public administration 1,965.2 1.6 1,831.8 1.6
Information 1,838.3 1.5 1,583.7 1.4
Accomodation & food services 1,501.1 1.2 1,339.6 1.2
Transportation & warehousing 1,436.5 1.2 1,360.4 1.2
Arts, entertainment & recreation 1,206.9 1.0 1,177.1 1.0
Administrative and support 1,037.3 0.9 1,011.7 0.9
1Industry groupings are loans in aggregate greater than $1 billion as of December 31, 2006 based on the North American Industry Classification System.
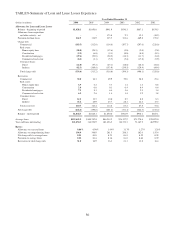
TABLE 7 - Allowance for Loan and Lease Losses
As of December 31
(Dollars in millions) 200612005120041200322002 2001
Allocation by Loan Type
Commercial $415.9 $439.6 $433.0 $369.3 $408.5 $435.8
Real estate 443.1 394.1 369.7 159.3 150.8 145.5
Consumer loans 95.5 109.4 159.6 344.3 332.8 251.3
Non-pool specific element 90.0 85.0 87.7 69.0 38.0 34.5
Total $1,044.5 $1,028.1 $1,050.0 $941.9 $930.1 $867.1
Year-end Loan Types as a Percent of
Total Loans
Commercial 28.8% 29.2 % 31.6 % 38.2 % 39.4 % 42.0 %
Real estate 61.2 58.7 55.2 47.0 44.5 42.3
Consumer loans 10.0 12.1 13.2 14.8 16.1 15.7
Total 100.0 % 100.0 % 100.0 % 100.0 % 100.0 % 100.0 %
1The 2006, 2005 and 2004 allocation reflects the implementation of a new ALLL methodology that is more granular than in prior periods. The new methodology segregates the portfolio into 17 sub-portfolios
and incorporates a weighted average of expected loss derived from an internal risk rating system. Beginning in 2004 the allocation also includes the acquired portfolio of NCF.
2In 2003 and prior periods, the allocation reflected an apportionment of the ALLL that had been categorized as “environmental factors,” which is now included in the Company’s homeogeneous loan pool
estimates.
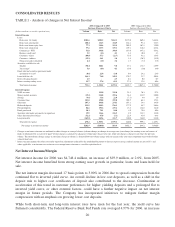
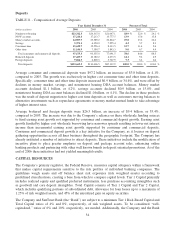
Loans
Total loans as of December 31, 2006 were $121.5 billion, an increase of $6.9 billion, or 6.0%, from
December 31, 2005. The growth rate was impacted by the sale from the portfolio of approximately $1.8
billion in residential real estate loans and the sale or securitization of $2.1 billion of consumer direct
student loans in 2006.
Residential mortgages increased $4.0 billion, or 13.2%, compared to December 31, 2005. This growth
was due to continued demand for portfolio products. Additionally impacting loan growth was strong
demand for construction lending resulting in a $2.8 billion, or 25.8%, increase in construction loans
compared to December 31, 2005. The majority of the Company’s construction portfolio is residential
real estate related which typically requires minimum pre-sales and equity from the borrower. The
construction lending portfolio has minimal exposure to speculative condo investor activity. Commercial
loans increased $0.8 billion, or 2.5%, from December 31, 2005, driven by increased corporate demand
and growth in lease financing.
27