SunTrust 2006 Annual Report Download - page 143
Download and view the complete annual report
Please find page 143 of the 2006 SunTrust annual report below. You can navigate through the pages in the report by either clicking on the pages listed below, or by using the keyword search tool below to find specific information within the annual report.-
 1
1 -
2
-
3
-
4
-
5
-
6
-
7
-
8
-
9
-
10
-
11
-
12
-
13
-
14
-
15
-
16
-
17
-
18
-
19
-
20
-
21
-
22
-
23
-
24
-
25
-
26
-
27
-
28
-
29
-
30
-
31
-
32
-
33
-
34
-
35
-
36
-
37
-
38
-
39
-
40
-
41
-
42
-
43
-
44
-
45
-
46
-
47
-
48
-
49
-
50
-
51
-
52
-
53
-
54
-
55
-
56
-
57
-
58
-
59
-
60
-
61
-
62
-
63
-
64
-
65
-
66
-
67
-
68
-
69
-
70
-
71
-
72
-
73
-
74
-
75
-
76
-
77
-
78
-
79
-
80
-
81
-
82
-
83
-
84
-
85
-
86
-
87
-
88
-
89
-
90
-
91
-
92
-
93
-
94
-
95
-
96
-
97
-
98
-
99
-
100
-
101
-
102
-
103
-
104
-
105
-
106
-
107
-
108
-
109
-
110
-
111
-
112
-
113
-
114
-
115
-
116
-
117
-
118
-
119
-
120
-
121
-
122
-
123
-
124
-
125
-
126
-
127
-
128
-
129
-
130
-
131
-
132
-
 133
133 -
 134
134 -
 135
135 -
 136
136 -
 137
137 -
 138
138 -
 139
139 -
 140
140 -
 141
141 -
 142
142 -
 143
143 -
 144
144 -
 145
145 -
 146
146 -
 147
147 -
 148
148 -
 149
149 -
 150
150 -
 151
151 -
 152
152 -
 153
153 -
154
-
155
-
156
-
157
-
158
-
159
 |
 |

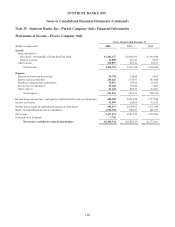
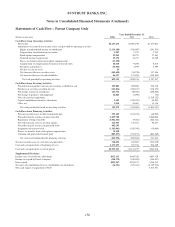
SUNTRUST BANKS, INC.
Notes to Consolidated Financial Statements (Continued)
Statements of Cash Flow – Parent Company Only
Year Ended December 31
(Dollars in thousands) 2006 2005 2004
Cash Flows from Operating Activities:
Net income $2,117,471 $1,987,239 $1,572,901
Adjustments to reconcile net income to net cash provided by operating activities:
Equity in undistributed income of subsidiaries (1,216,198) (308,407) (261,533)
Depreciation, amortization and accretion 1,907 5,573 5,381
Stock option compensation 25,969 26,375 17,443
Deferred income tax provision 19,378 16,753 14,789
Excess tax benefits from stock option compensation (33,258)
Amortization of compensation element of restricted stock 18,340 9,190 8,515
Securities (gains)/losses (15,065) 2,979 2,599
Net loss on sale of assets 20 --
Net (increase)/decrease in other assets (149,630) (54,220) 137,486
Net increase/(decrease) in other liabilities 86,397 173,054 (110,144)
Net cash provided by operating activities 855,331 1,858,536 1,387,437
Cash Flows from Investing Activities:
Proceeds from maturities and sales of securities available for sale 307,801 299,968 256,710
Purchases of securities available for sale (121,836) (200,187) (138,155)
Net change in loans to subsidiaries 123,372 (49,504) (486,506)
Net change in premises and equipment 12,823 (1,290) (32)
Net cash used for acquisitions -- (1,519,152)
Capital contributions from/(to) subsidiaries 2,105 (530,355) 42,202
Other, net 1,014 56,683 11,116
Net cash provided by/(used in) investing activities 325,279 (424,685) (1,833,817)
Cash Flows from Financing Activities:
Net increase/(decrease) in short-term borrowings 351,149 (101,236) (46,962)
Proceeds from the issuance of long-term debt 1,499,700 - 1,000,000
Repayment of long-term debt (1,012,563) (9,062) (208,761)
Proceeds from the exercise of stock options 215,947 135,701 96,457
Proceeds from the issuance of preferred stock 492,295 --
Acquisition of treasury stock (1,105,043) (196,396) (14,064)
Excess tax benefits from stock option compensation 33,258 --
Common and preferred dividends paid (887,297) (794,971) (603,309)
Net cash (used in)/provided by financing activities (412,554) (965,964) 223,361
Net increase/(decrease) in cash and cash equivalents 768,056 467,887 (223,019)
Cash and cash equivalents at beginning of year 1,171,257 703,370 926,389
Cash and cash equivalents at end of period $1,939,313 $1,171,257 $703,370
Supplemental Disclosure
Income taxes received from subsidiaries $615,131 $644,350 $604,729
Income taxes paid by Parent Company (548,570) (558,409) (544,037)
Interest paid $291,267 $234,537 $136,311
Net non-cash contribution of assets and liabilities to subsidiaries (34,311) (325,631) (4,319,794)
Non-cash impact of acquisition of NCF -- 5,517,551
130