SunTrust 2006 Annual Report Download - page 81
Download and view the complete annual report
Please find page 81 of the 2006 SunTrust annual report below. You can navigate through the pages in the report by either clicking on the pages listed below, or by using the keyword search tool below to find specific information within the annual report.-
 1
1 -
2
-
3
-
4
-
5
-
6
-
7
-
8
-
9
-
10
-
11
-
12
-
13
-
14
-
15
-
16
-
17
-
18
-
19
-
20
-
21
-
22
-
23
-
24
-
25
-
26
-
27
-
28
-
29
-
30
-
31
-
32
-
33
-
34
-
35
-
36
-
37
-
38
-
39
-
40
-
41
-
42
-
43
-
44
-
45
-
46
-
47
-
48
-
49
-
50
-
51
-
52
-
53
-
54
-
55
-
56
-
57
-
58
-
59
-
60
-
61
-
62
-
63
-
64
-
65
-
66
-
67
-
68
-
69
-
70
-
 71
71 -
 72
72 -
 73
73 -
 74
74 -
 75
75 -
 76
76 -
 77
77 -
 78
78 -
 79
79 -
 80
80 -
 81
81 -
 82
82 -
 83
83 -
 84
84 -
 85
85 -
 86
86 -
 87
87 -
 88
88 -
 89
89 -
 90
90 -
 91
91 -
92
-
93
-
94
-
95
-
96
-
97
-
98
-
99
-
100
-
101
-
102
-
103
-
104
-
105
-
106
-
107
-
108
-
109
-
110
-
111
-
112
-
113
-
114
-
115
-
116
-
117
-
118
-
119
-
120
-
121
-
122
-
123
-
124
-
125
-
126
-
127
-
128
-
129
-
130
-
131
-
132
-
133
-
134
-
135
-
136
-
137
-
138
-
139
-
140
-
141
-
142
-
143
-
144
-
145
-
146
-
147
-
148
-
149
-
150
-
151
-
152
-
153
-
154
-
155
-
156
-
157
-
158
-
159
 |
 |

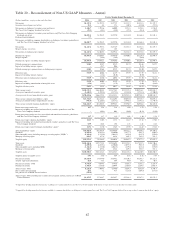
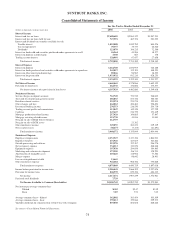
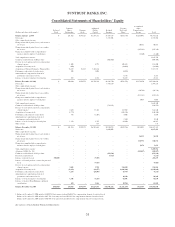
Table 21 – Reconcilement of Non-US GAAP Measures - Quarterly
Three Months Ended
2006 2005
(Dollars in millions, except per share and other data) December 31 September 30 June 30 March 31 December 31 September 30 June 30 March 31
Net income $506.3 $535.6 $544.0 $531.5 $518.5 $510.8 $465.7 $492.3
Securities losses/(gains), net of tax (21.9) 56.9 (3.6) (0.1) (0.4) 1.3 - 3.5
Net income excluding net securities gains and losses 484.4 592.5 540.4 531.4 518.1 512.1 465.7 495.8
The Coca-Cola Company dividend, net of tax (13.3) (13.3) (13.3) (13.3) (12.0) (12.0) (12.0) (12.0)
Net income excluding net securities gains and losses and The
Coca-Cola Company dividend, net of tax 471.1 579.2 527.1 518.1 506.1 500.1 453.7 483.8
Preferred stock dividends 7.7 - - - ---—
Net income available to common shareholders excluding net
securities (gains)/losses and The Coca-Cola Company
dividend, net of tax $463.4 $579.2 $527.1 $518.1 $506.1 $500.1 $453.7 $483.8
Net income $506.3 $535.6 $544.0 $531.5 $518.5 $510.8 $465.7 $492.3
Merger expense, net of tax - ---4.1 7.5 33.6 16.0
Net income excluding merger expenses $506.3 $535.6 $544.0 $531.5 $522.6 $518.3 $499.3 $508.3
Noninterest expense $1,233.8 $1,205.5 $1,214.1 $1,226.5 $1,206.9 $1,177.1 $1,172.8 $1,133.9
Merger expense - ---(6.5) (12.1) (54.3) (25.7)
Noninterest expense excluding merger expense $1,233.8 $1,205.5 $1,214.1 $1,226.5 $1,200.4 $1,165.0 $1,118.5 $1,108.2
Diluted earnings per common share $1.39 $1.47 $1.49 $1.46 $1.43 $1.40 $1.28 $1.36
Impact of excluding merger expense - ---0.01 0.02 0.09 0.04
Diluted earnings per common share excluding merger expense $1.39 $1.47 $1.49 $1.46 $1.44 $1.42 $1.37 $1.40
Efficiency ratio 59.67 % 59.30 % 58.78 % 59.80 % 60.20 % 58.62 % 61.30 % 60.22 %
Impact of excluding merger expense - ---(0.33) (0.61) (2.84) (1.37)
Efficiency ratio excluding merger expenses 59.67 % 59.30 % 58.78 % 59.80 % 59.87 % 58.01 % 58.46 % 58.85 %
Efficiency ratio 59.67 % 59.30 % 58.78 % 59.80 % 60.20 % 58.62 % 61.30 % 60.22 %
Impact of excluding amortization of intangible assets (1.18) (1.27) (1.25) (1.33) (1.41) (1.49) (1.56) (1.66)
Tangible efficiency ratio 58.49 % 58.03 % 57.53 % 58.47 % 58.79 % 57.13 % 59.74 % 58.56 %
Total average assets $182,343.3 $180,500.9 $180,744.1 $177,618.3 $175,769.1 $169,934.0 $165,253.6 $161,218.2
Average net unrealized securities gains (1,965.4) (1,374.6) (1,528.0) (1,612.8) (1,871.2) (2,102.2) (1,791.6) (2,032.8)
Average assets less net unrealized securities gains $180,377.9 $179,126.3 $179,216.1 $176,005.5 $173,897.9 $167,831.8 $163,462.0 $159,185.4
Total average common shareholders’ equity $17,655.5 $17,558.6 $17,304.4 $17,051.8 $16,875.6 $16,822.9 $16,275.6 $16,119.4
Average accumulated other comprehensive income (1,202.0) (821.3) (915.9) (963.7) (1,126.7) (1,331.1) (1,139.5) (1,285.3)
Total average realized common shareholders’ equity $16,453.5 $16,737.3 $16,388.5 $16,088.1 $15,748.9 $15,491.8 $15,136.1 $14,834.1
Return on average total assets 1.10 % 1.18 % 1.21 % 1.21 % 1.17 % 1.19 % 1.13 % 1.24 %
Impact of excluding net realized and unrealized securities
gains/losses and The Coca-Cola Company dividend (0.06) 0.10 (0.03) (0.02) (0.02) (0.01) (0.02) (0.01)
Return on average total assets less net realized and unrealized
securities gains/losses and The Coca-Cola Company
dividend 11.04 % 1.28 % 1.18 % 1.19 % 1.15 % 1.18 % 1.11 % 1.23 %
Return on average common shareholders’ equity 11.20 % 12.10 % 12.61 % 12.64 % 12.19 % 12.05 % 11.48 % 12.39 %
Impact of excluding net realized and unrealized securities
gains/losses and The Coca-Cola Company dividend (0.03) 1.63 0.29 0.42 0.56 0.76 0.54 0.84
Return on average realized common shareholders’ equity 211.17 % 13.73 % 12.90 % 13.06 % 12.75 % 12.81 % 12.02 % 13.23 %
Total shareholders’ equity $17,813.6 $18,589.3 $17,423.9 $17,157.4 $16,887.4 $16,717.8 $16,646.2 $16,104.3
Goodwill (6,889.8) (6,903.0) (6,900.2) (6,897.1) (6,835.1) (6,841.6) (6,873.1) (6,861.7)
Other intangible assets including mortgage servicing rights
(“MSRs”) (1,182.0) (1,120.1) (1,141.3) (1,123.5) (1,123.0) (1,112.9) (1,094.8) (1,073.2)
Mortgage servicing rights 810.5 724.3 720.4 680.8 657.6 613.5 565.7 514.2
Tangible equity $10,552.3 $11,290.5 $10,102.8 $9,817.6 $9,586.9 $9,376.8 $9,244.0 $8,683.6
Total assets $182,161.6 $183,104.6 $181,143.4 $178,876.5 $179,712.8 $172,416.1 $168,952.6 $164,811.0
Goodwill (6,889.8) (6,903.0) (6,900.2) (6,897.1) (6,835.1) (6,841.6) (6,873.1) (6,861.7)
Other intangible assets including MSRs (1,182.0) (1,120.1) (1,141.3) (1,123.5) (1,123.0) (1,112.9) (1,094.8) (1,073.2)
Mortgage servicing rights 810.5 724.3 720.4 680.8 657.6 613.5 565.7 514.2
Tangible assets $174,900.3 $175,805.8 $173,822.3 $171,536.7 $172,412.3 $165,075.1 $161,550.4 $157,390.3
Tangible equity to tangible assets 6.03 % 6.42 % 5.81 % 5.72 % 5.56 % 5.68 % 5.72 % 5.52 %
Net interest income $1,161.3 $1,151.4 $1,168.8 $1,179.0 $1,187.1 $1,156.7 $1,123.7 $1,111.6
Taxable - equivalent adjustment 23.9 22.5 21.2 20.4 20.0 19.0 18.7 17.6
Net interest income - FTE 1,185.2 1,173.9 1,190.0 1,199.4 1,207.1 1,175.7 1,142.4 1,129.2
Noninterest income 882.6 858.9 875.4 851.5 797.9 832.4 770.9 753.8
Total revenue - FTE 2,067.8 2,032.8 2,065.4 2,050.9 2,005.0 2,008.1 1,913.3 1,883.0
Net securities (gains)/losses (35.4) 91.8 (5.9) (0.1) (0.6) 2.1 - 5.7
Net gain on sale of RCM assets - --- - (3.5) - (19.9)
Net gain on sale of Bond Trustee business - (112.8) - - - ---
Total revenue - FTE excluding net securities (gains)/losses, net
gain on sale of RCM assets and net gain on sale of Bond
Trustee business $2,032.4 $2,011.8 $2,059.5 $2,050.8 $2,004.4 $2,006.7 $1,913.3 $1,868.8
1Computed by dividing annualized net income excluding net securities gains/losses and The Coca-Cola Company dividend, by average assets less net unrealized securities gains.
2Computed by dividing annualized net income available to common shareholders excluding net securities gains/losses and The Coca-Cola Company dividend, by average realized common shareholders’ equity.
68