SunTrust 2006 Annual Report Download - page 103
Download and view the complete annual report
Please find page 103 of the 2006 SunTrust annual report below. You can navigate through the pages in the report by either clicking on the pages listed below, or by using the keyword search tool below to find specific information within the annual report.-
 1
1 -
2
-
3
-
4
-
5
-
6
-
7
-
8
-
9
-
10
-
11
-
12
-
13
-
14
-
15
-
16
-
17
-
18
-
19
-
20
-
21
-
22
-
23
-
24
-
25
-
26
-
27
-
28
-
29
-
30
-
31
-
32
-
33
-
34
-
35
-
36
-
37
-
38
-
39
-
40
-
41
-
42
-
43
-
44
-
45
-
46
-
47
-
48
-
49
-
50
-
51
-
52
-
53
-
54
-
55
-
56
-
57
-
58
-
59
-
60
-
61
-
62
-
63
-
64
-
65
-
66
-
67
-
68
-
69
-
70
-
71
-
72
-
73
-
74
-
75
-
76
-
77
-
78
-
79
-
80
-
81
-
82
-
83
-
84
-
85
-
86
-
87
-
88
-
89
-
90
-
91
-
92
-
 93
93 -
 94
94 -
 95
95 -
 96
96 -
 97
97 -
 98
98 -
 99
99 -
 100
100 -
 101
101 -
 102
102 -
 103
103 -
 104
104 -
 105
105 -
 106
106 -
 107
107 -
 108
108 -
 109
109 -
 110
110 -
 111
111 -
 112
112 -
 113
113 -
114
-
115
-
116
-
117
-
118
-
119
-
120
-
121
-
122
-
123
-
124
-
125
-
126
-
127
-
128
-
129
-
130
-
131
-
132
-
133
-
134
-
135
-
136
-
137
-
138
-
139
-
140
-
141
-
142
-
143
-
144
-
145
-
146
-
147
-
148
-
149
-
150
-
151
-
152
-
153
-
154
-
155
-
156
-
157
-
158
-
159
 |
 |
SUNTRUST BANKS, INC.
Notes to Consolidated Financial Statements (Continued)
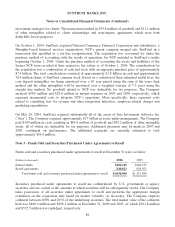
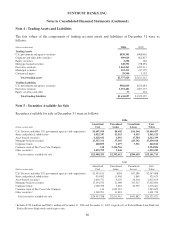
Note 4 - Trading Assets and Liabilities
The fair values of the components of trading account assets and liabilities at December 31 were as
follows:
(Dollars in thousands) 2006 2005
Trading Assets
U.S. government and agency securities $838,301 $468,056
Corporate and other debt securities 409,029 662,827
Equity securities 2,254 366
Mortgage-backed securities 140,531 278,294
Derivative contracts 1,064,263 1,059,311
Municipal securities 293,311 337,179
Commercial paper 29,940 5,192
Total trading assets $2,777,629 $2,811,225
Trading Liabilities
U.S. government and agency securities $382,819 $522,084
Derivative contracts 1,251,201 1,007,137
Equity securities and other 77 104
Total trading liabilities $1,634,097 $1,529,325
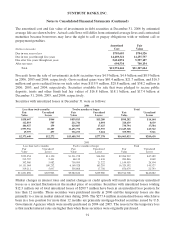
Note 5 - Securities Available for Sale
Securities available for sale at December 31 were as follows:
2006
(Dollars in thousands)
Amortized
Cost
Unrealized
Gains
Unrealized
Losses
Fair
Value
U.S. Treasury and other U.S. government agencies and corporations $1,607,999 $8,602 $16,144 $1,600,457
States and political subdivisions 1,032,247 13,515 4,639 1,041,123
Asset-backed securities 1,128,032 1,891 17,584 1,112,339
Mortgage-backed securities 17,337,311 37,365 243,762 17,130,914
Corporate bonds 468,855 1,477 7,521 462,811
Common stock of The Coca-Cola Company 110 2,324,716 - 2,324,826
Other securities11,423,799 5,446 - 1,429,245
Total securities available for sale $22,998,353 $2,393,012 $289,650 $25,101,715
2005
(Dollars in thousands)
Amortized
Cost
Unrealized
Gains
Unrealized
Losses
Fair
Value
U.S. Treasury and other U.S. government agencies and corporations $2,593,813 $584 $47,389 $2,547,008
States and political subdivisions 914,082 15,460 3,869 925,673
Asset-backed securities 1,630,751 8,207 26,304 1,612,654
Mortgage-backed securities 17,354,552 11,669 343,527 17,022,694
Corporate bonds 1,090,559 2,665 22,793 1,070,431
Common stock of The Coca-Cola Company 110 1,945,512 - 1,945,622
Other securities11,369,921 31,818 - 1,401,739
Total securities available for sale $24,953,788 $2,015,915 $443,882 $26,525,821
1Includes $729.4 million and $860.1 million at December 31, 2006 and December 31, 2005, respectively, of Federal Home Loan Bank and
Federal Reserve Bank stock stated at par value.
90