SunTrust 2006 Annual Report Download - page 59
Download and view the complete annual report
Please find page 59 of the 2006 SunTrust annual report below. You can navigate through the pages in the report by either clicking on the pages listed below, or by using the keyword search tool below to find specific information within the annual report.-
 1
1 -
2
-
3
-
4
-
5
-
6
-
7
-
8
-
9
-
10
-
11
-
12
-
13
-
14
-
15
-
16
-
17
-
18
-
19
-
20
-
21
-
22
-
23
-
24
-
25
-
26
-
27
-
28
-
29
-
30
-
31
-
32
-
33
-
34
-
35
-
36
-
37
-
38
-
39
-
40
-
41
-
42
-
43
-
44
-
45
-
46
-
47
-
48
-
 49
49 -
 50
50 -
 51
51 -
 52
52 -
 53
53 -
 54
54 -
 55
55 -
 56
56 -
 57
57 -
 58
58 -
 59
59 -
 60
60 -
 61
61 -
 62
62 -
 63
63 -
 64
64 -
 65
65 -
 66
66 -
 67
67 -
 68
68 -
 69
69 -
70
-
71
-
72
-
73
-
74
-
75
-
76
-
77
-
78
-
79
-
80
-
81
-
82
-
83
-
84
-
85
-
86
-
87
-
88
-
89
-
90
-
91
-
92
-
93
-
94
-
95
-
96
-
97
-
98
-
99
-
100
-
101
-
102
-
103
-
104
-
105
-
106
-
107
-
108
-
109
-
110
-
111
-
112
-
113
-
114
-
115
-
116
-
117
-
118
-
119
-
120
-
121
-
122
-
123
-
124
-
125
-
126
-
127
-
128
-
129
-
130
-
131
-
132
-
133
-
134
-
135
-
136
-
137
-
138
-
139
-
140
-
141
-
142
-
143
-
144
-
145
-
146
-
147
-
148
-
149
-
150
-
151
-
152
-
153
-
154
-
155
-
156
-
157
-
158
-
159
 |
 |

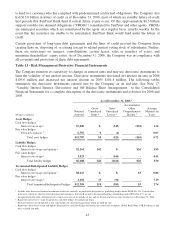
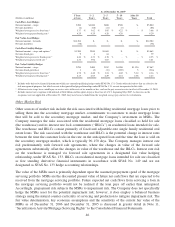
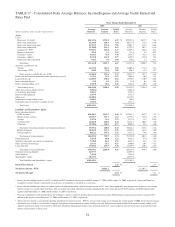
As of December 31, 2005 1
(Dollars in millions)
1 Year
or Less
1-2
Years
2-5
Years
5-10
Years
After 10
Years Total
Cash Flow Asset Hedges
Notional amount - swaps $300 $4,400 $600 $500 $- $5,800
Net unrealized loss (4) (68) (11) (5) - (88)
Weighted average receive fixed rate 23.17 % 3.62 % 3.95 % 4.22 % - % 3.68 %
Weighted average pay floating rate 24.29 4.29 4.29 4.29 - 4.29
Fair Value Asset Hedges
Notional amount - forwards $14,384 $- $- $- $- $14,384
Net unrealized loss (78) - - - - (78)
Cash Flow Liability Hedges
Notional amount - swaps and options 3$1,500 $500 $3,065 $- $- $5,065
Net unrealized gain 9 6 64 - - 79
Weighted average receive floating rate 24.46 % 4.33 % 4.30 % - % - % 4.35 %
Weighted average pay fixed rate 22.31 3.94 3.87 - - 3.41
Fair Value Liability Hedges
Notional amount - swaps $250 $400 $767 $4,900 $1,150 $7,467
Net unrealized gain/(loss) 1 (2) (31) (189) 5 (216)
Weighted average receive fixed rate 24.78 % 4.48 % 3.24 % 4.02 % 5.14 % 4.16 %
Weighted average pay floating rate 24.15 4.05 4.29 4.21 4.38 4.23
1Includes only derivative financial instruments which are currently qualifying hedges under SFAS No. 133. Certain other derivatives that are effective for
risk management purposes, but which are not in designated hedging relationships under SFAS No. 133, are not incorporated in this table.
2All interest rate swaps have variable pay or receive rates with resets of six months or less, and are the pay or receive rates in effect at December 31, 2005.
3Includes interest rate swaptions with notional of $0.4 billion and the option to pay a fixed rate of 4.31% beginning May 2007. As the rates on the
swaptions were not applicable at December 31, 2005, they have been excluded from the weighted average pay and receive calculations.
Other Market Risk
Other sources of market risk include the risk associated with holding residential mortgage loans prior to
selling them into the secondary mortgage market, commitments to customers to make mortgage loans
that will be sold to the secondary mortgage market, and the Company’s investment in MSRs. The
Company manages the risks associated with the residential mortgage loans classified as held for sale
(the warehouse) and its interest rate lock commitments (“IRLCs”) on residential loans intended for sale.
The warehouse and IRLCs consist primarily of fixed and adjustable-rate single family residential real
estate loans. The risk associated with the warehouse and IRLCs is the potential change in interest rates
between the time the customer locks in the rate on the anticipated loan and the time the loan is sold on
the secondary mortgage market, which is typically 90-150 days. The Company manages interest rate
risk predominately with forward sale agreements, where the changes in value of the forward sale
agreements substantially offset the changes in value of the warehouse and the IRLCs. Interest rate risk
on the warehouse is managed via forward sale agreements in a designated fair value hedging
relationship, under SFAS No. 133. IRLCs on residential mortgage loans intended for sale are classified
as free standing derivative financial instruments in accordance with SFAS No. 149 and are not
designated as SFAS No. 133 hedge accounting relationships.
The value of the MSRs asset is primarily dependent upon the assumed prepayment speed of the mortgage
servicing portfolio. MSRs are the discounted present value of future net cash flows that are expected to be
received from the mortgage servicing portfolio. Future expected net cash flows from servicing a loan in
the mortgage servicing portfolio would not be realized if the loan pays off earlier than anticipated.
Accordingly, prepayment risk subjects the MSRs to impairment risk. The Company does not specifically
hedge the MSRs asset for the potential impairment risk; however, it does employ a balanced business
strategy using the natural counter-cyclicality of servicing and production to mitigate impairment risk. The
fair value determination, key economic assumptions and the sensitivity of the current fair value of the
MSRs as of December 31, 2006 and December 31, 2005 is discussed in greater detail in Note 11,
“Securitization Activity/Mortgage Servicing Rights” to the Consolidated Financial Statements.
46