SunTrust 2006 Annual Report Download - page 29
Download and view the complete annual report
Please find page 29 of the 2006 SunTrust annual report below. You can navigate through the pages in the report by either clicking on the pages listed below, or by using the keyword search tool below to find specific information within the annual report.-
 1
1 -
2
-
3
-
4
-
5
-
6
-
7
-
8
-
9
-
10
-
11
-
12
-
13
-
14
-
15
-
16
-
17
-
18
-
 19
19 -
 20
20 -
 21
21 -
 22
22 -
 23
23 -
 24
24 -
 25
25 -
 26
26 -
 27
27 -
 28
28 -
 29
29 -
 30
30 -
 31
31 -
 32
32 -
 33
33 -
 34
34 -
 35
35 -
 36
36 -
 37
37 -
 38
38 -
 39
39 -
40
-
41
-
42
-
43
-
44
-
45
-
46
-
47
-
48
-
49
-
50
-
51
-
52
-
53
-
54
-
55
-
56
-
57
-
58
-
59
-
60
-
61
-
62
-
63
-
64
-
65
-
66
-
67
-
68
-
69
-
70
-
71
-
72
-
73
-
74
-
75
-
76
-
77
-
78
-
79
-
80
-
81
-
82
-
83
-
84
-
85
-
86
-
87
-
88
-
89
-
90
-
91
-
92
-
93
-
94
-
95
-
96
-
97
-
98
-
99
-
100
-
101
-
102
-
103
-
104
-
105
-
106
-
107
-
108
-
109
-
110
-
111
-
112
-
113
-
114
-
115
-
116
-
117
-
118
-
119
-
120
-
121
-
122
-
123
-
124
-
125
-
126
-
127
-
128
-
129
-
130
-
131
-
132
-
133
-
134
-
135
-
136
-
137
-
138
-
139
-
140
-
141
-
142
-
143
-
144
-
145
-
146
-
147
-
148
-
149
-
150
-
151
-
152
-
153
-
154
-
155
-
156
-
157
-
158
-
159
 |
 |

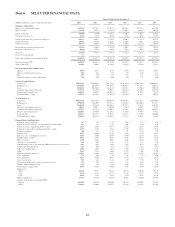
Item 6. SELECTED FINANCIAL DATA
Twelve Months Ended December 31
(Dollars in millions, except per share and other data) 2006 2005 2004 2003 2002 2001
Summary of Operations
Interest, fees, and dividend income $9,792.0 $7,731.3 $5,218.4 $4,768.8 $5,135.2 $6,279.6
Interest expense 5,131.6 3,152.3 1,533.2 1,448.5 1,891.5 3,027.0
Net interest income 4,660.4 4,579.0 3,685.2 3,320.3 3,243.7 3,252.6
Provision for loan losses 262.5 176.9 135.6 313.6 469.8 275.2
Net interest income after provision for loan losses 4,397.9 4,402.1 3,549.6 3,006.7 2,773.9 2,977.4
Noninterest income 3,468.4 3,155.0 2,604.4 2,303.0 2,268.8 2,051.9
Noninterest expense 4,879.9 4,690.7 3,897.0 3,400.6 3,219.4 2,999.9
Income before provision for income taxes 2,986.4 2,866.4 2,257.0 1,909.1 1,823.3 2,029.4
Provision for income taxes 869.0 879.2 684.1 576.8 491.5 653.9
Net income 2,117.4 1,987.2 1,572.9 1,332.3 1,331.8 1,375.5
Preferred stock dividends 7.7 -----
Net income available to common shareholders $2,109.7 $1,987.2 $1,572.9 $1,332.3 $1,331.8 $1,375.5
Net interest income-FTE $4,748.4 $4,654.5 $3,743.6 $3,365.3 $3,283.2 $3,293.4
Total revenue-FTE 8,216.8 7,809.5 6,348.0 5,668.3 5,552.0 5,345.3
Net income per average common share
Diluted $5.82 $5.47 $5.19 $4.73 $4.66 $4.72
Diluted, excluding merger expense 5.82 5.64 5.25 4.73 4.80 4.72
Basic 5.87 5.53 5.25 4.79 4.71 4.78
Dividends paid per average common share 2.44 2.20 2.00 1.80 1.72 1.60
Selected Average Balances
Total assets $180,315.1 $168,088.8 $133,754.3 $122,325.4 $108,516.1 $102,884.2
Earning assets 158,428.7 146,639.8 117,968.8 108,094.9 95,569.7 92,034.1
Loans 119,645.2 108,742.0 86,214.5 76,137.9 71,270.4 70,023.0
Consumer and commercial deposits 97,175.3 93,355.0 77,091.5 69,443.7 65,429.6 56,775.6
Brokered and foreign deposits 26,490.2 17,051.5 10,041.4 10,595.3 5,727.6 7,793.1
Total shareholders’ equity 17,546.7 16,526.3 11,469.5 9,083.0 8,725.7 8,073.8
As of December 31
Total assets $182,161.6 $179,712.8 $158,869.8 $125,250.5 $117,322.5 $104,740.6
Earning assets 159,063.8 156,640.9 137,813.4 111,266.5 103,696.6 93,327.5
Loans 121,454.3 114,554.9 101,426.2 80,732.3 73,167.9 68,959.2
Allowance for loan and lease losses 1,044.5 1,028.1 1,050.0 941.9 930.1 867.1
Consumer and commercial deposits 99,775.9 97,572.4 92,109.7 72,924.6 70,226.8 62,281.2
Brokered and foreign deposits 24,245.7 24,480.8 11,251.6 8,264.9 9,479.8 5,255.2
Long-term debt 18,992.9 20,779.2 22,127.2 15,313.9 11,879.8 12,660.6
Total shareholders’ equity 17,813.6 16,887.4 15,986.9 9,731.2 8,769.5 8,359.6
Financial Ratios and Other Data
Return on average total assets 1.17 % 1.18 % 1.18 % 1.09 % 1.23 % 1.34 %
Return on average total assets less net unrealized securities gains 1.17 1.17 1.19 1.01 1.10 1.24
Return on average common shareholders’ equity 12.13 12.02 13.71 14.67 15.26 17.04
Return on average realized common shareholders’ equity 12.72 12.70 15.65 15.98 16.67 19.68
Net interest margin 3.00 3.17 3.17 3.11 3.44 3.58
Efficiency ratio 59.39 60.06 61.39 59.99 57.99 56.12
Efficiency ratio, excluding merger expense 59.39 58.80 60.94 59.99 57.70 56.12
Tangible efficiency ratio 58.13 58.54 60.17 58.86 56.93 55.26
Effective tax rate 29.10 30.67 30.31 30.21 26.96 32.22
Allowance to year-end loans 0.86 0.90 1.04 1.17 1.27 1.26
Nonperforming assets to total loans plus OREO and other repossessed assets 0.49 0.29 0.40 0.47 0.74 0.87
Common dividend payout ratio 41.7 40.0 38.4 37.9 36.8 33.7
Full-service banking offices 1,701 1,657 1,676 1,183 1,184 1,128
ATMs 2,569 2,782 2,804 2,225 2,286 1,944
Full-time equivalent employees 33,599 33,406 33,156 27,578 27,622 28,391
Tier 1 capital ratio 7.72 % 7.01 % 7.16 % 7.85 % 7.47 % 8.02 %
Total capital ratio 11.11 10.57 10.36 11.75 11.62 12.18
Tier 1 leverage ratio 7.23 6.65 6.64 7.37 7.30 7.94
Total average shareholders’ equity to total average assets 9.73 9.83 8.58 7.43 8.04 7.85
Tangible equity to tangible assets 6.03 5.56 5.68 6.82 6.52 7.58
Book value per common share 48.78 46.65 44.30 34.52 31.04 28.97
Market price:
High $85.64 $75.77 $76.65 $71.73 $70.20 $72.35
Low 69.68 65.32 61.27 51.44 51.48 57.29
Close 84.45 72.76 73.88 71.50 56.92 62.70
Market capitalization 29,972 26,338 26,659 20,157 16,080 18,095
Average common shares outstanding (000s)
Diluted 362,802 363,454 303,309 281,434 286,052 291,584
Basic 359,413 359,066 299,375 278,295 282,495 287,702
16