SunTrust 2006 Annual Report Download - page 68
Download and view the complete annual report
Please find page 68 of the 2006 SunTrust annual report below. You can navigate through the pages in the report by either clicking on the pages listed below, or by using the keyword search tool below to find specific information within the annual report.-
 1
1 -
2
-
3
-
4
-
5
-
6
-
7
-
8
-
9
-
10
-
11
-
12
-
13
-
14
-
15
-
16
-
17
-
18
-
19
-
20
-
21
-
22
-
23
-
24
-
25
-
26
-
27
-
28
-
29
-
30
-
31
-
32
-
33
-
34
-
35
-
36
-
37
-
38
-
39
-
40
-
41
-
42
-
43
-
44
-
45
-
46
-
47
-
48
-
49
-
50
-
51
-
52
-
53
-
54
-
55
-
56
-
57
-
 58
58 -
 59
59 -
 60
60 -
 61
61 -
 62
62 -
 63
63 -
 64
64 -
 65
65 -
 66
66 -
 67
67 -
 68
68 -
 69
69 -
 70
70 -
 71
71 -
 72
72 -
 73
73 -
 74
74 -
 75
75 -
 76
76 -
 77
77 -
 78
78 -
79
-
80
-
81
-
82
-
83
-
84
-
85
-
86
-
87
-
88
-
89
-
90
-
91
-
92
-
93
-
94
-
95
-
96
-
97
-
98
-
99
-
100
-
101
-
102
-
103
-
104
-
105
-
106
-
107
-
108
-
109
-
110
-
111
-
112
-
113
-
114
-
115
-
116
-
117
-
118
-
119
-
120
-
121
-
122
-
123
-
124
-
125
-
126
-
127
-
128
-
129
-
130
-
131
-
132
-
133
-
134
-
135
-
136
-
137
-
138
-
139
-
140
-
141
-
142
-
143
-
144
-
145
-
146
-
147
-
148
-
149
-
150
-
151
-
152
-
153
-
154
-
155
-
156
-
157
-
158
-
159
 |
 |

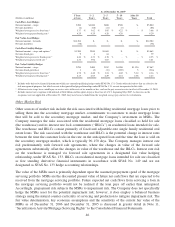
for internal management reporting purposes provide an enhanced view of analyzing the LOBs’ financial
performance. The internal allocations include the following: matched-maturity funds transfer pricing
and a fully taxable-equivalent gross-up on tax exempt loans and securities to create net interest income,
occupancy expense (inclusive of the cost to carry the assets), various support costs such as operational,
human resource and corporate finance, certain product-related expenses incurred within production
support areas, and overhead costs. Beginning January 2006, income tax expense was calculated based
on a marginal income tax rate which was modified to reflect the impact of various income tax
adjustments and credits that are unique to each business segment. Future enhancements to line of
business segment profitability reporting are expected to include: the attribution of economic capital and
the use of a provision for loan losses that uses a combination of net charge-offs and expected loss in lieu
of net charge-offs. The implementation of these enhancements to the internal management reporting
methodology, may materially affect the net income disclosed for each segment with no impact on
consolidated amounts. Whenever significant changes to management reporting methodologies take
place, the impact of these changes is quantified and prior period information is reclassified wherever
practicable. The Company will reflect these reclassified changes in the current period, and will provide
updated historical quarterly, year-to-date, and annual schedules.
Reconciling Items includes capital and various eliminations and management reporting offsets such as
the residual offsets derived from matched-maturity funds transfer pricing and the difference between
provision for loan losses and LOB net charge-offs. In the discussion, net of charge-offs represent the
allocated provision for loan losses for the lines of business. Corporate Other and Treasury’s provision
for loan losses represents the difference between consolidated provision for loan losses and the
aforementioned allocations.
The following analysis details the operating results for each line of business for the twelve months
ended December 31, 2006, 2005 and 2004. Prior periods have been restated to conform to the current
period’s presentation.
The following table for SunTrust’s reportable segments compares net income for the twelve months
ended December 31, 2006 to the same period in 2005 and 2004:
TABLE 18 - Net Income
Twelve Months Ended December 31
(Dollars in millions) 2006 2005 2004
Retail $750.5 $645.3 $475.8
Commercial 432.9 380.9 296.8
Corporate and Investment Banking 213.1 270.8 259.4
Mortgage 248.4 171.9 151.5
Wealth and Investment Management 267.3 187.2 152.6
Corporate Other and Treasury (2.7) 75.0 24.1
Reconciling Items 208.0 256.1 212.7
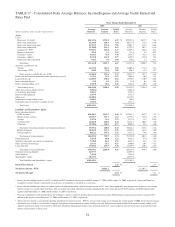
The following table for SunTrust’s reportable business segments compares average loans and average
deposits for the twelve months ended December 31, 2006 to the same period in the last two years:
TABLE 19 - Average Loans and Deposits
Twelve Months Ended December 31
Average Loans Average Deposits
(Dollars in millions) 2006 2005 2004 2006 2005 2004
Retail $30,885 $30,412 $24,379 $68,998 $65,239 $53,119
Commercial 32,439 30,760 23,730 13,787 13,409 11,360
Corporate and Investment Banking 16,507 15,286 13,670 3,117 3,289 3,265
Mortgage 31,233 24,206 18,006 1,811 1,654 1,382
Wealth and Investment Management 8,135 7,810 6,230 9,477 9,528 7,901
Corporate Other and Treasury 473 326 270 26,601 17,436 10,728
55