SunTrust 2006 Annual Report Download - page 74
Download and view the complete annual report
Please find page 74 of the 2006 SunTrust annual report below. You can navigate through the pages in the report by either clicking on the pages listed below, or by using the keyword search tool below to find specific information within the annual report.-
 1
1 -
2
-
3
-
4
-
5
-
6
-
7
-
8
-
9
-
10
-
11
-
12
-
13
-
14
-
15
-
16
-
17
-
18
-
19
-
20
-
21
-
22
-
23
-
24
-
25
-
26
-
27
-
28
-
29
-
30
-
31
-
32
-
33
-
34
-
35
-
36
-
37
-
38
-
39
-
40
-
41
-
42
-
43
-
44
-
45
-
46
-
47
-
48
-
49
-
50
-
51
-
52
-
53
-
54
-
55
-
56
-
57
-
58
-
59
-
60
-
61
-
62
-
63
-
 64
64 -
 65
65 -
 66
66 -
 67
67 -
 68
68 -
 69
69 -
 70
70 -
 71
71 -
 72
72 -
 73
73 -
 74
74 -
 75
75 -
 76
76 -
 77
77 -
 78
78 -
 79
79 -
 80
80 -
 81
81 -
 82
82 -
 83
83 -
 84
84 -
85
-
86
-
87
-
88
-
89
-
90
-
91
-
92
-
93
-
94
-
95
-
96
-
97
-
98
-
99
-
100
-
101
-
102
-
103
-
104
-
105
-
106
-
107
-
108
-
109
-
110
-
111
-
112
-
113
-
114
-
115
-
116
-
117
-
118
-
119
-
120
-
121
-
122
-
123
-
124
-
125
-
126
-
127
-
128
-
129
-
130
-
131
-
132
-
133
-
134
-
135
-
136
-
137
-
138
-
139
-
140
-
141
-
142
-
143
-
144
-
145
-
146
-
147
-
148
-
149
-
150
-
151
-
152
-
153
-
154
-
155
-
156
-
157
-
158
-
159
 |
 |
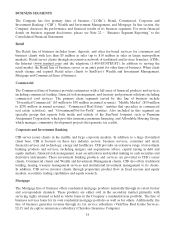
Corporate and Investment Banking
Corporate and Investments Bankings’s net income for the twelve months ended December 31, 2005 was
$270.8 million, an increase of $11.5 million, or 4.4%, compared to the same period in 2004.
Improvements in net interest income and investment banking income were the primary contributors to
the increase.
Fully taxable-equivalent net interest income increased $8.3 million, or 3.2%. Average loans increased
$1.6 billion, or 11.8%, and average deposits increased $24.3 million, or 0.7%. Core commercial loan
and lease growth was due to increased corporate demand and increased merger and acquisition activity.
Provision for loan losses, which represents net charge-offs for the lines of business, decreased $1.6
million, or 9.7% when compared to the same period in 2004.
Noninterest income increased $6.9 million, or 1.1%, driven by increased trading and advisory fees in
investment grade bond issuances, merger and acquisition, leasing, and fixed income/equity derivatives.
This was partially offset by reduced activity in equity offerings, securitizations, and credit trading.
Noninterest expense decreased $2.0 million, or 0.4%. This decrease was driven by the RCM divestiture
in the first quarter of 2005 and lower leveraged lease expense. This was partially offset by increased
personnel expense associated with increased fee income.
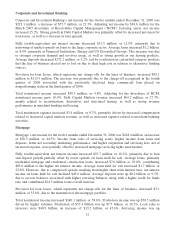
Mortgage
Mortgage’s net income for the twelve months ended December 31, 2005 was $171.9 million, an increase
of $20.3 million, or 13.4%, compared to the same period in 2004. Income from higher loan production,
net interest income from loan growth, and higher fees were the primary contributors to the increase. This
was partially offset by higher volume and growth-related expenses.
Fully taxable-equivalent net interest income increased $58.4 million, or 11.9%. Average loans, primarily
residential mortgage and residential construction loans, increased $6.2 billion, or 34.4% and contributed
$65.1 million to the higher net interest income. Average deposits increased $272.0 million, or 19.7%,
contributing $18.6 million to the increase in net interest income. Average mortgage loans held for sale
were up $2.7 billion or 55.6%. However, rising short-term interest rates resulted in compressed spreads,
causing a decline in net interest income of $14.9 million. Additional funding costs for higher
non-earning assets primarily due to the NCF acquisition reduced net interest income $10.6 million.
Provision for loan losses, which represents net charge-offs for the lines of business, increased $2.0
million or 55.3% when compared to the same period in 2004
Noninterest income increased $122.9 million, or 105.6%, primarily due to higher loan origination and
servicing income and the addition of NCF. Production for 2005 of $47.7 billion was up $16.9 billion or
54.9%. Loan sales to investors were $27.7 billion, an increase of $11.6 billion or 71.6%. Servicing
income was up $30.2 million primarily due to higher servicing fees from higher servicing balances, and
to a lesser extent, a decline in MSR amortization. As of December 31, 2005, total loans serviced were
$105.6 billion up $25.7 billion, or 32.1% from $79.9 billion at December 31, 2004. Other noninterest
income increased $6.6 million primarily due to volume-related fees.
Noninterest expense increased $149.9 million, or 40.3%, due to higher personnel expense and other
volume and growth related expenses, along with the addition of NCF. The higher personnel expense
resulted from growth in the sales force, higher volume-related commissions, and higher benefit costs.
61