SunTrust 2006 Annual Report Download - page 34
Download and view the complete annual report
Please find page 34 of the 2006 SunTrust annual report below. You can navigate through the pages in the report by either clicking on the pages listed below, or by using the keyword search tool below to find specific information within the annual report.-
 1
1 -
2
-
3
-
4
-
5
-
6
-
7
-
8
-
9
-
10
-
11
-
12
-
13
-
14
-
15
-
16
-
17
-
18
-
19
-
20
-
21
-
22
-
23
-
 24
24 -
 25
25 -
 26
26 -
 27
27 -
 28
28 -
 29
29 -
 30
30 -
 31
31 -
 32
32 -
 33
33 -
 34
34 -
 35
35 -
 36
36 -
 37
37 -
 38
38 -
 39
39 -
 40
40 -
 41
41 -
 42
42 -
 43
43 -
 44
44 -
45
-
46
-
47
-
48
-
49
-
50
-
51
-
52
-
53
-
54
-
55
-
56
-
57
-
58
-
59
-
60
-
61
-
62
-
63
-
64
-
65
-
66
-
67
-
68
-
69
-
70
-
71
-
72
-
73
-
74
-
75
-
76
-
77
-
78
-
79
-
80
-
81
-
82
-
83
-
84
-
85
-
86
-
87
-
88
-
89
-
90
-
91
-
92
-
93
-
94
-
95
-
96
-
97
-
98
-
99
-
100
-
101
-
102
-
103
-
104
-
105
-
106
-
107
-
108
-
109
-
110
-
111
-
112
-
113
-
114
-
115
-
116
-
117
-
118
-
119
-
120
-
121
-
122
-
123
-
124
-
125
-
126
-
127
-
128
-
129
-
130
-
131
-
132
-
133
-
134
-
135
-
136
-
137
-
138
-
139
-
140
-
141
-
142
-
143
-
144
-
145
-
146
-
147
-
148
-
149
-
150
-
151
-
152
-
153
-
154
-
155
-
156
-
157
-
158
-
159
 |
 |
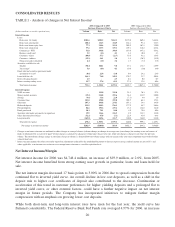
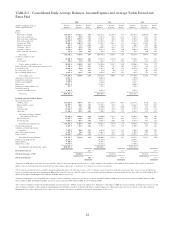
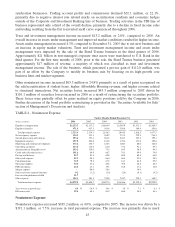
of 175 basis points over the 2005 average, and one-month LIBOR increased 167 basis points to average
5.13% in 2006. In contrast, the five-year swap rate averaged 5.23%, an increase of 75 basis points over
the 2005 average, and the ten-year swap rate increased 60 basis points over the same time period to an
average rate of 5.33%. As a result, incremental asset growth, in particular mortgage loans and mortgage
loans held for sale, were funded at tighter spreads due to higher short-term borrowing costs. The 2006
earning asset yield increased 92 basis points from 2005, while total interest-bearing liability costs
increased 128 basis points from the prior year. Loan yield improved 95 basis points and securities
available for sale yield increased 43 basis points from the prior year.
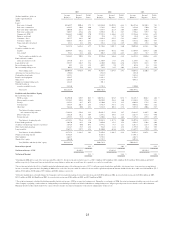
Average earning assets were up $11.8 billion, or 8.0%, and average interest-bearing liabilities increased
$11.2 billion, or 9.3%, for 2006 compared to 2005. Average loans increased $10.9 billion, or 10.0%,
primarily due to mortgage loans, average securities available for sale decreased $2.0 billion, or 7.7%,
and average loans held for sale increased $2.6 billion, or 31.2%, compared to 2005. The decline in
securities available for sale was a result of the 2006 repositioning initiative to improve the portfolio
yield and delever the balance sheet. Further details of the portfolio repositioning are provided in the
“Securities Available for Sale” section beginning on page 32.
The Company continued to take steps to obtain alternative lower cost funding sources, such as
developing initiatives to grow customer deposits. Campaigns to attract client deposits were implemented
in 2005 and continued in the fourth quarter of 2006 as evidenced by the $3.8 billion increase in average
consumer and commercial deposits compared to 2005. The net growth in consumer and commercial
deposits was entirely in certificates of deposit as consumers have focused on higher paying deposits in
the current rate environment. Low cost deposits (noninterest-bearing deposits, certain NOW accounts,
and savings) declined due to lower cost deposits migrating to higher cost certificates of deposits as well
as customers seeking alternative investments offered by the Company such as off balance sheet money
market mutual funds.
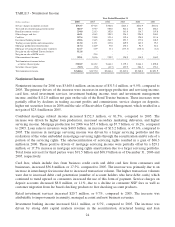
Interest income that the Company was unable to recognize on nonperforming loans had a negative
impact of one basis point on the net interest margin in both 2006 and 2005.
21