SunTrust 2006 Annual Report Download - page 86
Download and view the complete annual report
Please find page 86 of the 2006 SunTrust annual report below. You can navigate through the pages in the report by either clicking on the pages listed below, or by using the keyword search tool below to find specific information within the annual report.-
 1
1 -
2
-
3
-
4
-
5
-
6
-
7
-
8
-
9
-
10
-
11
-
12
-
13
-
14
-
15
-
16
-
17
-
18
-
19
-
20
-
21
-
22
-
23
-
24
-
25
-
26
-
27
-
28
-
29
-
30
-
31
-
32
-
33
-
34
-
35
-
36
-
37
-
38
-
39
-
40
-
41
-
42
-
43
-
44
-
45
-
46
-
47
-
48
-
49
-
50
-
51
-
52
-
53
-
54
-
55
-
56
-
57
-
58
-
59
-
60
-
61
-
62
-
63
-
64
-
65
-
66
-
67
-
68
-
69
-
70
-
71
-
72
-
73
-
74
-
75
-
 76
76 -
 77
77 -
 78
78 -
 79
79 -
 80
80 -
 81
81 -
 82
82 -
 83
83 -
 84
84 -
 85
85 -
 86
86 -
 87
87 -
 88
88 -
 89
89 -
 90
90 -
 91
91 -
 92
92 -
 93
93 -
 94
94 -
 95
95 -
 96
96 -
97
-
98
-
99
-
100
-
101
-
102
-
103
-
104
-
105
-
106
-
107
-
108
-
109
-
110
-
111
-
112
-
113
-
114
-
115
-
116
-
117
-
118
-
119
-
120
-
121
-
122
-
123
-
124
-
125
-
126
-
127
-
128
-
129
-
130
-
131
-
132
-
133
-
134
-
135
-
136
-
137
-
138
-
139
-
140
-
141
-
142
-
143
-
144
-
145
-
146
-
147
-
148
-
149
-
150
-
151
-
152
-
153
-
154
-
155
-
156
-
157
-
158
-
159
 |
 |

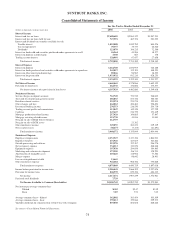
SUNTRUST BANKS, INC.
Consolidated Statements of Income
For the Twelve Months Ended December 31
(Dollars in thousands except per share data) 2006 2005 2004
Interest Income
Interest and fees on loans $7,688,689 $5,961,122 $3,947,231
Interest and fees on loans held for sale 727,991 485,724 281,292
Interest and dividends on securities available for sale
Taxable interest 1,022,888 1,032,785 844,526
Tax-exempt interest 39,357 35,733 26,340
Dividends1123,870 104,215 72,580
Interest on funds sold and securities purchased under agreements to resell 56,964 43,206 18,577
Interest on deposits in other banks 3,360 867 178
Trading account interest 128,901 67,657 27,658
Total interest income 9,792,020 7,731,309 5,218,382
Interest Expense
Interest on deposits 3,464,700 1,832,975 766,188
Interest on funds purchased and securities sold under agreements to repurchase 543,057 312,193 108,591
Interest on other short-term borrowings 89,866 94,965 30,195
Interest on long-term debt 1,033,932 912,210 628,253
Total interest expense 5,131,555 3,152,343 1,533,227
Net Interest Income 4,660,465 4,578,966 3,685,155
Provision for loan losses 262,536 176,886 135,537
Net interest income after provision for loan losses 4,397,929 4,402,080 3,549,618
Noninterest Income
Service charges on deposit accounts 763,720 772,519 700,022
Trust and investment management income 686,865 673,720 586,783
Retail investment services 233,974 213,274 192,811
Other charges and fees 462,063 456,481 390,494
Investment banking income 230,553 216,530 206,730
Trading account profits and commissions 113,047 145,120 127,799
Card fees 247,647 210,779 153,439
Mortgage production related income 217,428 144,885 57,847
Mortgage servicing related income 121,738 41,856 11,083
Net gain on sale of Bond Trustee business 112,759 --
Net gain on sale of RCM assets -23,382 -
Other noninterest income 329,055 263,653 219,129
Net securities losses (50,477) (7,155) (41,691)
Total noninterest income 3,468,372 3,155,044 2,604,446
Noninterest Expense
Employee compensation 2,253,527 2,117,156 1,804,911
Employee benefits 471,926 417,055 363,402
Outside processing and software 393,576 357,387 286,270
Net occupancy expense 334,213 312,070 268,248
Equipment expense 197,038 204,038 184,865
Marketing and customer development 173,205 156,711 128,291
Amortization of intangible assets 103,226 118,964 77,582
Merger expense -98,642 28,401
Loss on extinguishment of debt 11,665 --
Other noninterest expense 941,484 908,706 755,068
Total noninterest expense 4,879,860 4,690,729 3,897,038
Income before provision for income taxes 2,986,441 2,866,395 2,257,026
Provision for income taxes 868,970 879,156 684,125
Net income 2,117,471 1,987,239 1,572,901
Preferred stock dividends 7,729 --
Net Income Available to Common Shareholders $2,109,742 $1,987,239 $1,572,901
Net income per average common share
Diluted $5.82 $5.47 $5.19
Basic 5.87 5.53 5.25
Average common shares - diluted 362,802 363,454 303,309
Average common shares - basic 359,413 359,066 299,375
1Includes dividends on common stock of The Coca-Cola Company $59,850 $54,058 $48,266
See notes to Consolidated Financial Statements.
73