SunTrust 2006 Annual Report Download - page 43
Download and view the complete annual report
Please find page 43 of the 2006 SunTrust annual report below. You can navigate through the pages in the report by either clicking on the pages listed below, or by using the keyword search tool below to find specific information within the annual report.-
 1
1 -
2
-
3
-
4
-
5
-
6
-
7
-
8
-
9
-
10
-
11
-
12
-
13
-
14
-
15
-
16
-
17
-
18
-
19
-
20
-
21
-
22
-
23
-
24
-
25
-
26
-
27
-
28
-
29
-
30
-
31
-
32
-
 33
33 -
 34
34 -
 35
35 -
 36
36 -
 37
37 -
 38
38 -
 39
39 -
 40
40 -
 41
41 -
 42
42 -
 43
43 -
 44
44 -
 45
45 -
 46
46 -
 47
47 -
 48
48 -
 49
49 -
 50
50 -
 51
51 -
 52
52 -
 53
53 -
54
-
55
-
56
-
57
-
58
-
59
-
60
-
61
-
62
-
63
-
64
-
65
-
66
-
67
-
68
-
69
-
70
-
71
-
72
-
73
-
74
-
75
-
76
-
77
-
78
-
79
-
80
-
81
-
82
-
83
-
84
-
85
-
86
-
87
-
88
-
89
-
90
-
91
-
92
-
93
-
94
-
95
-
96
-
97
-
98
-
99
-
100
-
101
-
102
-
103
-
104
-
105
-
106
-
107
-
108
-
109
-
110
-
111
-
112
-
113
-
114
-
115
-
116
-
117
-
118
-
119
-
120
-
121
-
122
-
123
-
124
-
125
-
126
-
127
-
128
-
129
-
130
-
131
-
132
-
133
-
134
-
135
-
136
-
137
-
138
-
139
-
140
-
141
-
142
-
143
-
144
-
145
-
146
-
147
-
148
-
149
-
150
-
151
-
152
-
153
-
154
-
155
-
156
-
157
-
158
-
159
 |
 |

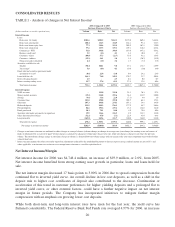
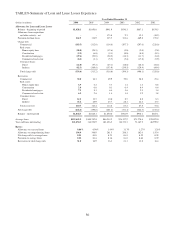
TABLE 8-Summary of Loan and Lease Losses Experience
Year Ended December 31
(Dollars in millions) 2006 2005 2004 2003 2002 2001
Allowance for Loan and Lease Losses
Balance - beginning of period $1,028.1 $1,050.0 $941.9 $930.1 $867.1 $874.5
Allowance from acquisitions
and other activity - net -- 173.8 9.3 15.5 (10.2)
Provision for loan losses 262.5 176.9 135.5 313.6 469.8 275.2
Charge-offs
Commercial (183.5) (112.0) (114.6) (197.7) (297.0) (220.0)
Real estate:
Home equity lines (28.8) (24.5) (12.6) (5.8) (5.0) (2.8)
Construction (2.3) (6.0) (4.1) (0.8) (0.8) (0.3)
Residential mortgages (29.6) (22.8) (20.2) (16.3) (11.7) (8.0)
Commercial real estate (8.1) (3.1) (5.5) (5.6) (17.8) (5.9)
Consumer loans:
Direct (22.0) (37.2) (25.1) (28.6) (28.4) (24.6)
Indirect (82.3) (109.6) (133.9) (139.5) (129.4) (64.4)
Total charge-offs (356.6) (315.2) (316.0) (394.3) (490.1) (326.0)
Recoveries
Commercial 30.0 36.3 49.9 39.8 28.8 25.4
Real estate:
Home equity lines 6.9 6.2 3.3 1.4 1.4 0.8
Construction 2.0 0.8 0.1 0.4 0.4 0.4
Residential mortgages 7.9 8.1 6.4 3.6 2.3 1.4
Commercial real estate 6.2 2.6 1.4 1.4 3.9 1.8
Consumer loans:
Direct 12.1 13.5 10.0 8.5 8.8 8.3
Indirect 45.4 48.9 43.7 28.1 22.2 15.5
Total recoveries 110.5 116.4 114.8 83.2 67.8 53.6
Net charge-offs (246.1) (198.8) (201.2) (311.1) (422.3) (272.4)
Balance - end of period $1,044.5 $1,028.1 $1,050.0 $941.9 $930.1 $867.1
Average loans $119,645.2 $108,742.0 $86,214.5 $76,137.9 $71,270.4 $70,023.0
Year-end loans outstanding 121,454.3 114,554.9 101,426.2 80,732.3 73,167.9 68,959.2
Ratios:
Allowance to year-end loans 0.86% 0.90% 1.04% 1.17% 1.27% 1.26%
Allowance to nonperforming loans 196.4 346.9 281.3 268.1 182.0 155.4
Net charge-offs to average loans 0.21 0.18 0.23 0.41 0.59 0.39
Provision to average loans 0.22 0.16 0.16 0.41 0.66 0.39
Recoveries to total charge-offs 31.0 36.9 36.3 21.1 13.8 16.4
30