SunTrust 2006 Annual Report Download - page 130
Download and view the complete annual report
Please find page 130 of the 2006 SunTrust annual report below. You can navigate through the pages in the report by either clicking on the pages listed below, or by using the keyword search tool below to find specific information within the annual report.-
 1
1 -
2
-
3
-
4
-
5
-
6
-
7
-
8
-
9
-
10
-
11
-
12
-
13
-
14
-
15
-
16
-
17
-
18
-
19
-
20
-
21
-
22
-
23
-
24
-
25
-
26
-
27
-
28
-
29
-
30
-
31
-
32
-
33
-
34
-
35
-
36
-
37
-
38
-
39
-
40
-
41
-
42
-
43
-
44
-
45
-
46
-
47
-
48
-
49
-
50
-
51
-
52
-
53
-
54
-
55
-
56
-
57
-
58
-
59
-
60
-
61
-
62
-
63
-
64
-
65
-
66
-
67
-
68
-
69
-
70
-
71
-
72
-
73
-
74
-
75
-
76
-
77
-
78
-
79
-
80
-
81
-
82
-
83
-
84
-
85
-
86
-
87
-
88
-
89
-
90
-
91
-
92
-
93
-
94
-
95
-
96
-
97
-
98
-
99
-
100
-
101
-
102
-
103
-
104
-
105
-
106
-
107
-
108
-
109
-
110
-
111
-
112
-
113
-
114
-
115
-
116
-
117
-
118
-
119
-
 120
120 -
 121
121 -
 122
122 -
 123
123 -
 124
124 -
 125
125 -
 126
126 -
 127
127 -
 128
128 -
 129
129 -
 130
130 -
 131
131 -
 132
132 -
 133
133 -
 134
134 -
 135
135 -
 136
136 -
 137
137 -
 138
138 -
 139
139 -
 140
140 -
141
-
142
-
143
-
144
-
145
-
146
-
147
-
148
-
149
-
150
-
151
-
152
-
153
-
154
-
155
-
156
-
157
-
158
-
159
 |
 |

SUNTRUST BANKS, INC.
Notes to Consolidated Financial Statements (Continued)
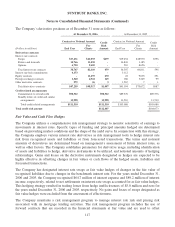
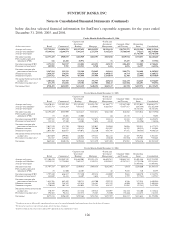
The Company’s derivative positions as of December 31 were as follows:
At December 31, 2006 At December 31, 2005
Contract or Notional Amount Credit
Risk
Amount
Contract or Notional Amount Credit
Risk
Amount(Dollars in millions)End User
For
Clients End User
For
Clients
Derivatives contracts
Interest rate contracts
Swaps $17,231 $61,055 $679 $19,454 $48,970 $596
Futures and forwards 14,766 11,450 - 16,843 3,185 -
Options 6,750 9,605 - 210 8,656 -
Total interest rate contracts 38,747 82,110 679 36,507 60,811 596
Interest rate lock commitments 6,173 - - 3,112 - -
Equity contracts - 11,459 270 22 9,605 291
Foreign exchange contracts 1,360 4,922 145 186 5,249 99
Other derivative contracts 979 26 3 1,567 7 1
Total derivatives contracts $47,259 $98,517 $1,097 $41,394 $75,672 $987
Credit-related arrangements
Commitments to extend credit $98,512 $98,512 $89,576 $89,576
Standby letters of credit and similar
arrangements 12,998 12,998 13,510 13,510
Total credit-related arrangements $111,510 $111,510 $103,086 $103,086
Total credit risk amount $112,607 $104,073
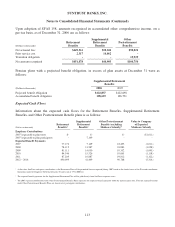
Fair Value and Cash Flow Hedges
The Company utilizes a comprehensive risk management strategy to monitor sensitivity of earnings to
movements in interest rates. Specific types of funding and principal amounts hedged are determined
based on prevailing market conditions and the shape of the yield curve. In conjunction with this strategy,
the Company employs various interest rate derivatives as risk management tools to hedge interest rate
risk from recognized assets and liabilities or from forecasted transactions. The terms and notional
amounts of derivatives are determined based on management’s assessment of future interest rates, as
well as other factors. The Company establishes parameters for derivative usage, including identification
of assets and liabilities to hedge, derivative instruments to be utilized, and notional amounts of hedging
relationships. Gains and losses on the derivative instruments designated as hedges are expected to be
highly effective in offsetting changes in fair values or cash flows of the hedged assets, liabilities and
forecasted transactions.
The Company has designated interest rate swaps as fair value hedges of changes in the fair value of
recognized liabilities due to changes in the benchmark interest rate. For the years ended December 31,
2006 and 2005, the Company recognized $64.7 million of interest expense and $89.2 million of interest
income, respectively, related to net settlements on interest rate swaps accounted for as fair value hedges.
This hedging strategy resulted in trading losses from hedge ineffectiveness of $5.0 million and zero for
the years ended December 31, 2006 and 2005, respectively. No gains and losses of swaps designated as
fair value hedges were excluded from the assessment of effectiveness.
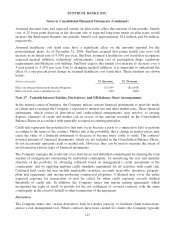
The Company maintains a risk management program to manage interest rate risk and pricing risk
associated with its mortgage lending activities. The risk management program includes the use of
forward contracts that are recorded in the financial statements at fair value and are used to offset
117