SunTrust 2006 Annual Report Download - page 32
Download and view the complete annual report
Please find page 32 of the 2006 SunTrust annual report below. You can navigate through the pages in the report by either clicking on the pages listed below, or by using the keyword search tool below to find specific information within the annual report.-
 1
1 -
2
-
3
-
4
-
5
-
6
-
7
-
8
-
9
-
10
-
11
-
12
-
13
-
14
-
15
-
16
-
17
-
18
-
19
-
20
-
21
-
 22
22 -
 23
23 -
 24
24 -
 25
25 -
 26
26 -
 27
27 -
 28
28 -
 29
29 -
 30
30 -
 31
31 -
 32
32 -
 33
33 -
 34
34 -
 35
35 -
 36
36 -
 37
37 -
 38
38 -
 39
39 -
 40
40 -
 41
41 -
 42
42 -
43
-
44
-
45
-
46
-
47
-
48
-
49
-
50
-
51
-
52
-
53
-
54
-
55
-
56
-
57
-
58
-
59
-
60
-
61
-
62
-
63
-
64
-
65
-
66
-
67
-
68
-
69
-
70
-
71
-
72
-
73
-
74
-
75
-
76
-
77
-
78
-
79
-
80
-
81
-
82
-
83
-
84
-
85
-
86
-
87
-
88
-
89
-
90
-
91
-
92
-
93
-
94
-
95
-
96
-
97
-
98
-
99
-
100
-
101
-
102
-
103
-
104
-
105
-
106
-
107
-
108
-
109
-
110
-
111
-
112
-
113
-
114
-
115
-
116
-
117
-
118
-
119
-
120
-
121
-
122
-
123
-
124
-
125
-
126
-
127
-
128
-
129
-
130
-
131
-
132
-
133
-
134
-
135
-
136
-
137
-
138
-
139
-
140
-
141
-
142
-
143
-
144
-
145
-
146
-
147
-
148
-
149
-
150
-
151
-
152
-
153
-
154
-
155
-
156
-
157
-
158
-
159
 |
 |
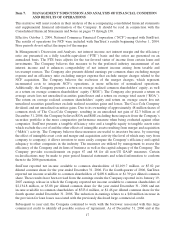
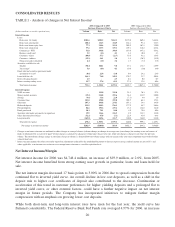
•Net interest income-FTE increased $93.9 million, or 2.0%; however the net interest margin declined
17 basis points to 3.00%. The margin decline was the result of the flat to inverted yield curve
experienced throughout 2006 which compressed interest rate spreads on earning assets. The average
earning asset yield increased 92 basis points compared to 2005 while the average interest bearing
liability cost increased 128 basis points, resulting in a 36 basis point decline in interest rate spread.
Additionally, there was a shift in the mix of deposits to higher cost products, with certificates of
deposits increasing, while other deposit products, specifically DDA, money market, and savings,
declined.
•Noninterest income improved $313.3 million, or 9.9%, compared to 2005. The increase was driven
by strong mortgage production and servicing income and gain on the sale of the Bond Trustee
business.
•Noninterest expense increased $189.1 million, or 4.0%, compared to 2005. The increase was driven
by higher personnel costs due to increased headcount, normal merit raises, and higher benefits cost.
•Net charge-offs as a percentage of average loans was 0.21% for 2006 and included the charge-off of
a large commercial loan that was determined to be nonperforming in the third quarter of 2006. This
credit was the primary driver of an $85.6 million, or 48.4%, increase in provision for loan losses
compared to 2005. Nonperforming assets increased $259.6 million compared to December 31, 2005
due primarily to an increase in residential real estate nonperforming loans, which was driven mainly
by the maturation of this portfolio, and more specifically in well-collateralized or insured conforming
and Alt-A first mortgage loans.
19