SunTrust 2006 Annual Report Download - page 44
Download and view the complete annual report
Please find page 44 of the 2006 SunTrust annual report below. You can navigate through the pages in the report by either clicking on the pages listed below, or by using the keyword search tool below to find specific information within the annual report.-
 1
1 -
2
-
3
-
4
-
5
-
6
-
7
-
8
-
9
-
10
-
11
-
12
-
13
-
14
-
15
-
16
-
17
-
18
-
19
-
20
-
21
-
22
-
23
-
24
-
25
-
26
-
27
-
28
-
29
-
30
-
31
-
32
-
33
-
 34
34 -
 35
35 -
 36
36 -
 37
37 -
 38
38 -
 39
39 -
 40
40 -
 41
41 -
 42
42 -
 43
43 -
 44
44 -
 45
45 -
 46
46 -
 47
47 -
 48
48 -
 49
49 -
 50
50 -
 51
51 -
 52
52 -
 53
53 -
 54
54 -
55
-
56
-
57
-
58
-
59
-
60
-
61
-
62
-
63
-
64
-
65
-
66
-
67
-
68
-
69
-
70
-
71
-
72
-
73
-
74
-
75
-
76
-
77
-
78
-
79
-
80
-
81
-
82
-
83
-
84
-
85
-
86
-
87
-
88
-
89
-
90
-
91
-
92
-
93
-
94
-
95
-
96
-
97
-
98
-
99
-
100
-
101
-
102
-
103
-
104
-
105
-
106
-
107
-
108
-
109
-
110
-
111
-
112
-
113
-
114
-
115
-
116
-
117
-
118
-
119
-
120
-
121
-
122
-
123
-
124
-
125
-
126
-
127
-
128
-
129
-
130
-
131
-
132
-
133
-
134
-
135
-
136
-
137
-
138
-
139
-
140
-
141
-
142
-
143
-
144
-
145
-
146
-
147
-
148
-
149
-
150
-
151
-
152
-
153
-
154
-
155
-
156
-
157
-
158
-
159
 |
 |

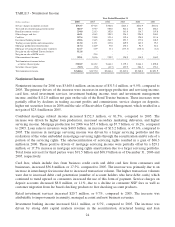
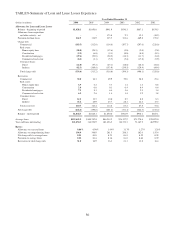
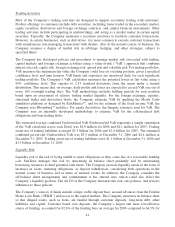
TABLE 9 - Nonperforming Assets and Accruing Loans Past Due 90 Days or More
As of December 31,
(Dollars in millions) 2006 2005 2004 2003 2002 2001
Nonperforming Assets
Nonaccrual loans
Commercial $106.8 $70.9 $130.9 $165.9 $351.3 $377.6
Real estate
Construction 38.6 24.4 32.8 4.4 10.0 4.0
Residential mortgages 286.7 103.3 104.5 85.4 82.5 79.9
Commercial Real Estate 55.4 44.6 36.7 48.6 38.0 62.8
Consumer loans 16.3 28.7 49.3 32.2 29.2 33.8
Total nonaccrual loans 503.8 271.9 354.2 336.5 511.0 558.1
Restructured loans 28.0 24.4 19.1 14.8 - -
Total nonperforming loans 531.8 296.3 373.3 351.3 511.0 558.1
Other real estate owned (OREO) 55.4 30.7 28.6 16.5 18.0 20.7
Other repossessed assets 6.6 7.2 8.8 10.3 13.0 21.0
Total nonperforming assets $593.8 $334.2 $410.7 $378.1 $542.0 $599.8
Ratios
Nonperforming loans to total loans 0.44 % 0.26 % 0.37 % 0.44 % 0.70 % 0.81 %
Nonperforming assets to total loans
plus OREO and other repossessed assets 0.49 0.29 0.40 0.47 0.74 0.87
Accruing Loans Past Due 90 Days or More $351.5 $371.5 $214.3 $196.4 $177.9 $185.5
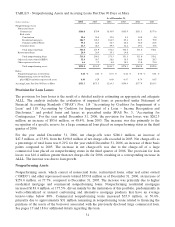
Provision for Loan Losses
The provision for loan losses is the result of a detailed analysis estimating an appropriate and adequate
ALLL. The analysis includes the evaluation of impaired loans as prescribed under Statement of
Financial Accounting Standards (“SFAS”) Nos. 114 “Accounting by Creditors for Impairment of a
Loan” and 118 “Accounting by Creditors for Impairment of a Loan – Income Recognition and
Disclosures,” and pooled loans and leases as prescribed under SFAS No. 5, “Accounting for
Contingencies.” For the year ended December 31, 2006, the provision for loan losses was $262.5
million, an increase of $85.6 million, or 48.4%, from 2005. The increase was due primarily to the
recognition of a specific reserve for a large commercial loan placed on nonperforming status in the third
quarter of 2006.
For the year ended December 31, 2006, net charge-offs were $246.1 million, an increase of
$47.3 million, or 23.8%, from the $198.8 million of net charge-offs recorded in 2005. Net charge-offs as
a percentage of total loans was 0.21% for the year ended December 31, 2006, an increase of three basis
points compared to 2005. The increase in net charge-offs was due to the charge-off of a large
commercial loan placed on nonperforming status in the third quarter of 2006. The provision for loan
losses was $16.4 million greater than net charge-offs for 2006, resulting in a corresponding increase in
ALLL. The increase was due to loan growth.
Nonperforming Assets
Nonperforming assets, which consist of nonaccrual loans, restructured loans, other real estate owned
(“OREO”) and other repossessed assets totaled $593.8 million as of December 31, 2006, an increase of
$259.6 million, or 77.7%, compared to December 31, 2005. The increase was primarily due to higher
residential mortgage and commercial nonperforming loans. Nonperforming residential mortgages
increased $183.4 million, or 177.5%, driven mainly by the maturation of this portfolio, predominantly in
well-collateralized or insured conforming and alternative mortgage products that have an average
loan-to-value below 80%. Commercial nonperforming loans increased $35.9 million, or 50.6%,
primarily due to approximately $31 million remaining in nonperforming loans related to financing the
purchase of the assets of the borrower associated with the previously disclosed large commercial loan.
See pages 17 and 18 for additional details regarding this loan.
31