SunTrust 2006 Annual Report Download - page 136
Download and view the complete annual report
Please find page 136 of the 2006 SunTrust annual report below. You can navigate through the pages in the report by either clicking on the pages listed below, or by using the keyword search tool below to find specific information within the annual report.-
 1
1 -
2
-
3
-
4
-
5
-
6
-
7
-
8
-
9
-
10
-
11
-
12
-
13
-
14
-
15
-
16
-
17
-
18
-
19
-
20
-
21
-
22
-
23
-
24
-
25
-
26
-
27
-
28
-
29
-
30
-
31
-
32
-
33
-
34
-
35
-
36
-
37
-
38
-
39
-
40
-
41
-
42
-
43
-
44
-
45
-
46
-
47
-
48
-
49
-
50
-
51
-
52
-
53
-
54
-
55
-
56
-
57
-
58
-
59
-
60
-
61
-
62
-
63
-
64
-
65
-
66
-
67
-
68
-
69
-
70
-
71
-
72
-
73
-
74
-
75
-
76
-
77
-
78
-
79
-
80
-
81
-
82
-
83
-
84
-
85
-
86
-
87
-
88
-
89
-
90
-
91
-
92
-
93
-
94
-
95
-
96
-
97
-
98
-
99
-
100
-
101
-
102
-
103
-
104
-
105
-
106
-
107
-
108
-
109
-
110
-
111
-
112
-
113
-
114
-
115
-
116
-
117
-
118
-
119
-
120
-
121
-
122
-
123
-
124
-
125
-
 126
126 -
 127
127 -
 128
128 -
 129
129 -
 130
130 -
 131
131 -
 132
132 -
 133
133 -
 134
134 -
 135
135 -
 136
136 -
 137
137 -
 138
138 -
 139
139 -
 140
140 -
 141
141 -
 142
142 -
 143
143 -
 144
144 -
 145
145 -
 146
146 -
147
-
148
-
149
-
150
-
151
-
152
-
153
-
154
-
155
-
156
-
157
-
158
-
159
 |
 |

SUNTRUST BANKS, INC.
Notes to Consolidated Financial Statements (Continued)
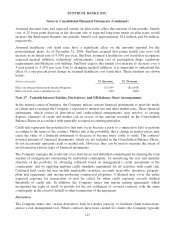
managing the timing of payment shock, private mortgage insurance and underwriting guidelines and
practices. A geographic concentration arises because the Company operates primarily in the
Southeastern and Mid-Atlantic regions of the United States. SunTrust engages in limited international
banking activities. The Company’s total cross-border outstandings were $693.1 million and $412.8
million as of December 31, 2006 and December 31, 2005, respectively.
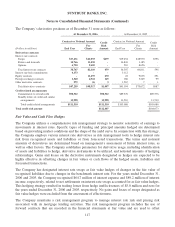
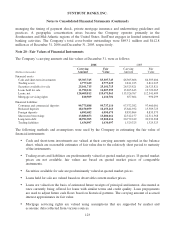
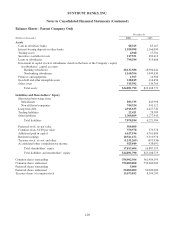
Note 20 - Fair Values of Financial Instruments
The Company’s carrying amounts and fair values at December 31, were as follows:
2006 2005
(Dollars in thousands)
Carrying
Amount
Fair
Value
Carrying
Amount
Fair
Value
Financial assets
Cash and short-term investments $5,307,745 $5,307,745 $6,305,606 $6,305,606
Trading assets 2,777,629 2,777,629 2,811,225 2,811,225
Securities available for sale 25,101,715 25,101,715 26,525,821 26,525,821
Loans held for sale 11,790,122 11,807,395 13,695,613 13,729,065
Loans, net 120,409,812 119,673,963 113,526,767 112,341,489
Mortgage servicing rights 810,509 1,110,701 657,604 996,299
Financial liabilities
Consumer and commercial deposits 99,775,888 99,737,114 97,572,382 97,460,001
Brokered deposits 18,150,059 18,153,263 15,644,932 15,589,723
Foreign deposits 6,095,682 6,095,675 8,835,864 8,835,573
Short-term borrowings 13,880,653 13,880,661 12,312,157 12,311,568
Long-term debt 18,992,905 19,202,616 20,779,249 20,932,308
Trading liabilities 1,634,097 1,634,097 1,529,325 1,529,325
The following methods and assumptions were used by the Company in estimating the fair value of
financial instruments:
•Cash and short-term investments are valued at their carrying amounts reported in the balance
sheet, which are reasonable estimates of fair value due to the relatively short period to maturity
of the instruments.
•Trading assets and liabilities are predominantly valued at quoted market prices. If quoted market
prices are not available, fair values are based on quoted market prices of comparable
instruments.
•Securities available for sale are predominantly valued at quoted market prices.
•Loans held for sale are valued based on observable current market prices.
•Loans are valued on the basis of estimated future receipts of principal and interest, discounted at
rates currently being offered for loans with similar terms and credit quality. Loan prepayments
are used to adjust future cash flows based on historical patterns. The carrying amount of accrued
interest approximates its fair value.
•Mortgage servicing rights are valued using assumptions that are supported by market and
economic data collected from various sources.
123