SunTrust 2006 Annual Report Download - page 64
Download and view the complete annual report
Please find page 64 of the 2006 SunTrust annual report below. You can navigate through the pages in the report by either clicking on the pages listed below, or by using the keyword search tool below to find specific information within the annual report.-
 1
1 -
2
-
3
-
4
-
5
-
6
-
7
-
8
-
9
-
10
-
11
-
12
-
13
-
14
-
15
-
16
-
17
-
18
-
19
-
20
-
21
-
22
-
23
-
24
-
25
-
26
-
27
-
28
-
29
-
30
-
31
-
32
-
33
-
34
-
35
-
36
-
37
-
38
-
39
-
40
-
41
-
42
-
43
-
44
-
45
-
46
-
47
-
48
-
49
-
50
-
51
-
52
-
53
-
 54
54 -
 55
55 -
 56
56 -
 57
57 -
 58
58 -
 59
59 -
 60
60 -
 61
61 -
 62
62 -
 63
63 -
 64
64 -
 65
65 -
 66
66 -
 67
67 -
 68
68 -
 69
69 -
 70
70 -
 71
71 -
 72
72 -
 73
73 -
 74
74 -
75
-
76
-
77
-
78
-
79
-
80
-
81
-
82
-
83
-
84
-
85
-
86
-
87
-
88
-
89
-
90
-
91
-
92
-
93
-
94
-
95
-
96
-
97
-
98
-
99
-
100
-
101
-
102
-
103
-
104
-
105
-
106
-
107
-
108
-
109
-
110
-
111
-
112
-
113
-
114
-
115
-
116
-
117
-
118
-
119
-
120
-
121
-
122
-
123
-
124
-
125
-
126
-
127
-
128
-
129
-
130
-
131
-
132
-
133
-
134
-
135
-
136
-
137
-
138
-
139
-
140
-
141
-
142
-
143
-
144
-
145
-
146
-
147
-
148
-
149
-
150
-
151
-
152
-
153
-
154
-
155
-
156
-
157
-
158
-
159
 |
 |

fourth quarter of 2006, compared to 29.0% for the fourth quarter of 2005. The decrease in the effective
tax rate was primarily the result of an annual adjustment of the estimated current taxes payable to the
actual current taxes payable reflected on the Company’s 2005 federal and state tax returns filed in
September and October of 2006.
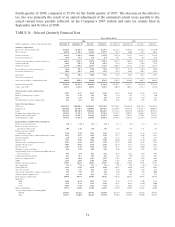
TABLE 16 - Selected Quarterly Financial Data
Three Months Ended
2006 2005
(Dollars in millions, except per share and other data) December 31 September 30 June 30 March 31 December 31 September 30 June 30 March 31
Summary of Operations
Interest, fees, and dividend income $2,564.7 $2,525.5 $2,423.1 $2,278.7 $2,175.3 $1,996.7 $1,843.3 $1,716.0
Interest expense 1,403.4 1,374.1 1,254.3 1,099.7 988.3 840.0 719.6 604.4
Net interest income 1,161.3 1,151.4 1,168.8 1,179.0 1,187.0 1,156.7 1,123.7 1,111.6
Provision for loan losses 115.8 61.6 51.8 33.4 48.1 70.4 47.8 10.6
Net interest income after provision for loan losses 1,045.5 1,089.8 1,117.0 1,145.6 1,138.9 1,086.3 1,075.9 1,101.0
Noninterest income 882.6 858.9 875.4 851.5 797.9 832.4 770.9 753.8
Noninterest expense 1,233.8 1,205.5 1,214.1 1,226.5 1,206.9 1,177.1 1,172.8 1,133.9
Income before provision for income taxes 694.3 743.2 778.3 770.6 729.9 741.6 674.0 720.9
Provision for income taxes 188.0 207.6 234.3 239.1 211.4 230.8 208.3 228.6
Net income 506.3 535.6 544.0 531.5 518.5 510.8 465.7 492.3
Preferred stock dividends 7.7-------
Net income available to common shareholders $498.6 $535.6 $544.0 $531.5 $518.5 $510.8 $465.7 $492.3
Net interest income-FTE $1,185.2 $1,173.9 $1,190.0 $1,199.4 $1,207.1 $1,175.7 $1,142.4 $1,129.2
Total revenue-FTE 2,067.8 2,032.8 2,065.4 2,050.9 2,005.0 2,008.1 1,913.3 1,883.0
Net income per average common share
Diluted $1.39 $1.47 $1.49 $1.46 $1.43 $1.40 $1.28 $1.36
Diluted, excluding merger expense 1.39 1.47 1.49 1.46 1.44 1.42 1.37 1.40
Basic 1.41 1.48 1.51 1.48 1.44 1.42 1.30 1.37
Dividends paid per average common share 0.61 0.61 0.61 0.61 0.55 0.55 0.55 0.55
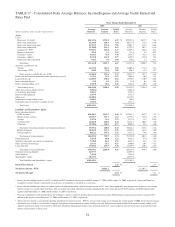
Selected Average Balances
Total assets $182,343.3 $180,500.9 $180,744.1 $177,618.3 $175,769.1 $169,934.0 $165,253.6 $161,218.2
Earning assets 160,114.8 158,914.7 158,888.8 155,742.9 153,489.8 148,552.6 144,283.3 140,064.7
Loans 121,363.8 120,742.0 120,144.5 116,262.3 113,827.6 110,818.4 106,966.7 103,215.8
Consumer and commercial deposits 98,552.9 97,642.5 97,172.3 95,292.4 95,257.2 94,075.7 93,064.5 90,967.8
Brokered and foreign deposits 26,124.2 27,958.3 27,194.3 24,651.7 21,009.9 17,969.2 15,709.1 13,424.4
Total shareholders’ equity 18,155.5 17,661.8 17,304.4 17,051.8 16,875.6 16,822.9 16,275.6 16,119.4
Financial Ratios and Other Data (Annualized)
Return on average total assets 1.10 % 1.18 % 1.21 % 1.21 % 1.17 % 1.19 % 1.13 % 1.24 %
Return on average assets less net
unrealized securities gains 1.04 1.28 1.18 1.19 1.15 1.18 1.11 1.23
Return on average common
shareholders’ equity 11.20 12.10 12.61 12.64 12.19 12.05 11.48 12.39
Return on average realized common shareholders’ equity 11.17 13.73 12.90 13.06 12.75 12.81 12.02 13.23
Net interest margin 2.94 2.93 3.00 3.12 3.12 3.14 3.18 3.27
Efficiency ratio 59.67 59.30 58.78 59.80 60.20 58.62 61.30 60.22
Efficiency ratio, excluding merger expense 59.67 59.30 58.78 59.80 59.87 58.01 58.46 58.85
Tangible efficiency ratio 58.49 58.03 57.53 58.47 58.79 57.13 59.74 58.56
Effective tax rate 27.07 27.94 30.10 31.03 28.97 31.12 30.90 31.71
Allowance to period-end loans 0.86 0.90 0.88 0.88 0.90 0.92 0.95 0.98
Nonperforming assets to total loans plus OREO and other
repossessed assets 0.49 0.52 0.31 0.28 0.29 0.32 0.35 0.37
Common dividend payout ratio 43.3 41.1 40.9 41.6 38.3 39.0 42.7 40.3
Full-service banking offices 1,701 1,699 1,695 1,677 1,657 1,647 1,642 1,693
ATMs 2,569 2,568 2,564 2,786 2,782 2,769 2,761 2,804
Full-time equivalent employees 33,599 34,293 34,155 33,697 33,406 33,013 32,751 33,139
Tier 1 capital ratio 7.72 % 7.70 % 7.31 % 7.26 % 7.01 % 7.03 % 7.04 % 7.07 %
Total capital ratio 11.11 11.07 10.70 10.88 10.57 10.66 10.25 10.44
Tier 1 leverage ratio 7.23 7.27 6.82 6.71 6.65 6.64 6.65 6.61
Total average shareholders’ equity to average assets 9.96 9.78 9.57 9.60 9.60 9.90 9.85 10.00
Tangible equity to tangible assets 6.03 6.42 5.81 5.72 5.56 5.68 5.72 5.52
Book value per common share $48.78 $49.71 $47.85 $47.22 $46.65 $46.28 $45.96 $44.59
Market price:
High 85.64 81.59 78.33 76.75 75.46 75.77 75.00 74.18
Low 76.76 75.11 72.56 69.68 65.32 68.85 69.60 69.00
Close 84.45 77.28 76.26 72.76 72.76 69.45 72.24 72.07
Market capitalization 29,972 28,120 27,768 26,437 26,338 25,089 26,162 26,030
Average common shares outstanding (000s)
Diluted 358,292 365,121 364,391 363,437 363,175 363,854 363,642 363,138
Basic 354,677 361,805 361,267 359,934 359,203 359,702 359,090 358,253
51