SunTrust 2006 Annual Report Download - page 105
Download and view the complete annual report
Please find page 105 of the 2006 SunTrust annual report below. You can navigate through the pages in the report by either clicking on the pages listed below, or by using the keyword search tool below to find specific information within the annual report.-
 1
1 -
2
-
3
-
4
-
5
-
6
-
7
-
8
-
9
-
10
-
11
-
12
-
13
-
14
-
15
-
16
-
17
-
18
-
19
-
20
-
21
-
22
-
23
-
24
-
25
-
26
-
27
-
28
-
29
-
30
-
31
-
32
-
33
-
34
-
35
-
36
-
37
-
38
-
39
-
40
-
41
-
42
-
43
-
44
-
45
-
46
-
47
-
48
-
49
-
50
-
51
-
52
-
53
-
54
-
55
-
56
-
57
-
58
-
59
-
60
-
61
-
62
-
63
-
64
-
65
-
66
-
67
-
68
-
69
-
70
-
71
-
72
-
73
-
74
-
75
-
76
-
77
-
78
-
79
-
80
-
81
-
82
-
83
-
84
-
85
-
86
-
87
-
88
-
89
-
90
-
91
-
92
-
93
-
94
-
 95
95 -
 96
96 -
 97
97 -
 98
98 -
 99
99 -
 100
100 -
 101
101 -
 102
102 -
 103
103 -
 104
104 -
 105
105 -
 106
106 -
 107
107 -
 108
108 -
 109
109 -
 110
110 -
 111
111 -
 112
112 -
 113
113 -
 114
114 -
 115
115 -
116
-
117
-
118
-
119
-
120
-
121
-
122
-
123
-
124
-
125
-
126
-
127
-
128
-
129
-
130
-
131
-
132
-
133
-
134
-
135
-
136
-
137
-
138
-
139
-
140
-
141
-
142
-
143
-
144
-
145
-
146
-
147
-
148
-
149
-
150
-
151
-
152
-
153
-
154
-
155
-
156
-
157
-
158
-
159
 |
 |

SUNTRUST BANKS, INC.
Notes to Consolidated Financial Statements (Continued)
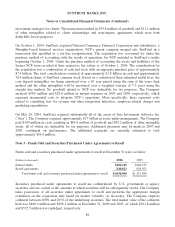
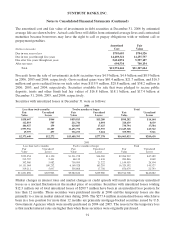
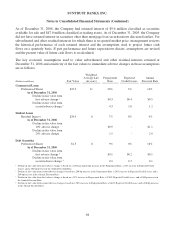
During the second half of 2006, the Company restructured a portion of the investment portfolio. As part
of the restructuring, the Company sold $4.4 billion of shorter-term securities across several categories,
namely mortgage-backed and agency securities, with a 3.62% yield and reinvested approximately $2.4
billion in longer-term securities with a 5.55% yield. In addition to reinvesting in these securities, $1.5
billion of receive-fixed interest rate swaps on commercial loans were executed at 5.50% to extend the
duration of the balance sheet and improve the earning asset yield. Securities losses of $116.1 million
were realized in conjunction with the restructuring. These losses represented approximately 2.6% of the
securities sold. The underlying securities began gradually incurring unrealized losses approximately two
years ago in connection with the increase in interest rates. The Company’s analysis indicated that the
combination of these steps were sufficient to achieve its current asset liability management objectives.
The Company continues to monitor economic and Company specific performance in order to determine
if incremental balance sheet management tactics are appropriate. The Company reviews all of its
securities for impairment at least quarterly. As of December 31, 2006 the Company has the ability and
intent to hold the remaining securities with unrealized losses to recovery. The Company has determined
that there were no other-than-temporary impairments associated with the above securities at
December 31, 2006.
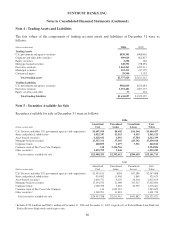
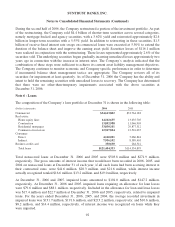
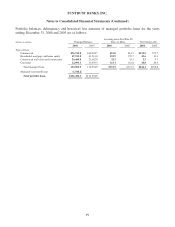
Note 6 - Loans
The composition of the Company’s loan portfolio at December 31 is shown in the following table:
(Dollars in thousands) 2006 2005
Commercial $34,613,882 $33,764,183
Real estate:
Home equity lines 14,102,655 13,635,705
Construction 13,892,988 11,046,903
Residential mortgages 33,830,101 29,877,312
Commercial real estate 12,567,824 12,516,035
Consumer:
Direct 4,160,091 5,060,844
Indirect 7,936,102 8,389,401
Business credit card 350,690 264,512
Total loans $121,454,333 $114,554,895
Total nonaccrual loans at December 31, 2006 and 2005 were $503.8 million and $271.9 million,
respectively. The gross amounts of interest income that would have been recorded in 2006, 2005, and
2004 on nonaccrual loans at December 31 of each year, if all such loans had been accruing interest at
their contractual rates, were $41.6 million, $28.3 million, and $21.6 million, while interest income
actually recognized totaled $16.6 million, $13.2 million, and $19.0 million, respectively.
At December 31, 2006 and 2005, impaired loans amounted to $101.0 million and $147.2 million,
respectively. At December 31, 2006 and 2005, impaired loans requiring an allowance for loan losses
were $79.6 million and $88.1 million, respectively. Included in the allowance for loan and lease losses
was $17.4 million and $22.7 million at December 31, 2006 and 2005, respectively, related to impaired
loans. For the years ended December 31, 2006, 2005, and 2004, the average recorded investment in
impaired loans was $131.7 million, $191.6 million, and $213.2 million, respectively; and $10.6 million,
$8.2 million, and $14.4 million, respectively, of interest income was recognized on loans while they
were impaired.
92