SunTrust 2006 Annual Report Download - page 83
Download and view the complete annual report
Please find page 83 of the 2006 SunTrust annual report below. You can navigate through the pages in the report by either clicking on the pages listed below, or by using the keyword search tool below to find specific information within the annual report.-
 1
1 -
2
-
3
-
4
-
5
-
6
-
7
-
8
-
9
-
10
-
11
-
12
-
13
-
14
-
15
-
16
-
17
-
18
-
19
-
20
-
21
-
22
-
23
-
24
-
25
-
26
-
27
-
28
-
29
-
30
-
31
-
32
-
33
-
34
-
35
-
36
-
37
-
38
-
39
-
40
-
41
-
42
-
43
-
44
-
45
-
46
-
47
-
48
-
49
-
50
-
51
-
52
-
53
-
54
-
55
-
56
-
57
-
58
-
59
-
60
-
61
-
62
-
63
-
64
-
65
-
66
-
67
-
68
-
69
-
70
-
71
-
72
-
 73
73 -
 74
74 -
 75
75 -
 76
76 -
 77
77 -
 78
78 -
 79
79 -
 80
80 -
 81
81 -
 82
82 -
 83
83 -
 84
84 -
 85
85 -
 86
86 -
 87
87 -
 88
88 -
 89
89 -
 90
90 -
 91
91 -
 92
92 -
 93
93 -
94
-
95
-
96
-
97
-
98
-
99
-
100
-
101
-
102
-
103
-
104
-
105
-
106
-
107
-
108
-
109
-
110
-
111
-
112
-
113
-
114
-
115
-
116
-
117
-
118
-
119
-
120
-
121
-
122
-
123
-
124
-
125
-
126
-
127
-
128
-
129
-
130
-
131
-
132
-
133
-
134
-
135
-
136
-
137
-
138
-
139
-
140
-
141
-
142
-
143
-
144
-
145
-
146
-
147
-
148
-
149
-
150
-
151
-
152
-
153
-
154
-
155
-
156
-
157
-
158
-
159
 |
 |

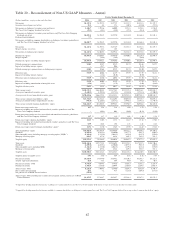
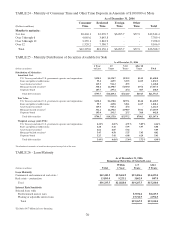
TABLE 24 - Maturity of Consumer Time and Other Time Deposits in Amounts of $100,000 or More
As of December 31, 2006
(Dollars in millions)
Consumer
Time
Brokered
Time
Foreign
Time
Other
Time Total
Months to maturity:
3 or less $3,404.1 $3,076.7 $6,095.7 $37.9 $12,614.4
Over 3 through 6 4,065.6 3,643.8 - - 7,709.4
Over 6 through 12 3,235.1 3,842.9 - - 7,078.0
Over 12 1,520.2 7,586.7 - - 9,106.9
Total $12,225.0 $18,150.1 $6,095.7 $37.9 $36,508.7
TABLE 25 - Maturity Distribution of Securities Available for Sale
As of December 31, 2006
(Dollars in millions)
1 Year
or Less
1-5
Years
5-10
Years
After 10
Years Total
Distribution of Maturities:
Amortized Cost
U.S. Treasury and other U.S. government agencies and corporations $138.9 $1,254.7 $199.5 $14.9 $1,608.0
States and political subdivisions 99.4 465.9 323.5 143.5 1,032.3
Asset-backed securities1119.3 961.2 47.5 - 1,128.0
Mortgage-backed securities1330.4 11,490.5 5,019.0 497.4 17,337.3
Corporate bonds 107.7 297.1 25.4 38.7 468.9
Total debt securities $795.7 $14,469.4 $5,614.9 $694.5 $21,574.5
Fair Value
U.S. Treasury and other U.S. government agencies and corporations $138.2 $1,250.8 $197.1 $14.4 $1,600.5
States and political subdivisions 99.5 469.8 328.1 143.7 1,041.1
Asset-backed securities1119.6 945.1 47.6 - 1,112.3
Mortgage-backed securities1332.2 11,296.6 4,998.9 503.2 17,130.9
Corporate bonds 105.0 293.5 25.5 38.8 462.8
Total debt securities $794.5 $14,255.8 $5,597.2 $700.1 $21,347.6
Weighted average yield (FTE):
U.S. Treasury and other U.S. government agencies and corporations 4.24% 4.69% 4.71% 5.05% 4.66%
States and political subdivisions 6.28 6.16 5.95 5.97 6.08
Asset-backed securities16.62 4.87 5.62 - 5.09
Mortgage-backed securities15.45 4.58 5.25 5.65 4.82
Corporate bonds 5.25 5.41 6.08 6.29 5.43
Total debt securities 5.49% 4.68% 5.30% 5.72% 4.90%
1Distribution of maturities is based on the expected average life of the asset.
TABLE 26 - Loan Maturity
As of December 31, 2006
Remaining Maturities of Selected Loans
(Dollars in millions) Total
Within
1 Year
1-5
Years
After
5 Years
Loan Maturity
Commercial and commercial real estate 1$42,442.5 $12,604.9 $15,404.6 $14,433.0
Real estate - construction 13,893.0 9,223.1 3,862.9 807.0
Total $56,335.5 $21,828.0 $19,267.5 $15,240.0
Interest Rate Sensitivity
Selected loans with:
Predetermined interest rates $3,554.6 $8,245.5
Floating or adjustable interest rates 15,712.9 6,994.5
Total $19,267.5 $15,240.0
1Excludes $4.7 billion in lease financing.
70