SunTrust 2006 Annual Report Download - page 88
Download and view the complete annual report
Please find page 88 of the 2006 SunTrust annual report below. You can navigate through the pages in the report by either clicking on the pages listed below, or by using the keyword search tool below to find specific information within the annual report.-
 1
1 -
2
-
3
-
4
-
5
-
6
-
7
-
8
-
9
-
10
-
11
-
12
-
13
-
14
-
15
-
16
-
17
-
18
-
19
-
20
-
21
-
22
-
23
-
24
-
25
-
26
-
27
-
28
-
29
-
30
-
31
-
32
-
33
-
34
-
35
-
36
-
37
-
38
-
39
-
40
-
41
-
42
-
43
-
44
-
45
-
46
-
47
-
48
-
49
-
50
-
51
-
52
-
53
-
54
-
55
-
56
-
57
-
58
-
59
-
60
-
61
-
62
-
63
-
64
-
65
-
66
-
67
-
68
-
69
-
70
-
71
-
72
-
73
-
74
-
75
-
76
-
77
-
 78
78 -
 79
79 -
 80
80 -
 81
81 -
 82
82 -
 83
83 -
 84
84 -
 85
85 -
 86
86 -
 87
87 -
 88
88 -
 89
89 -
 90
90 -
 91
91 -
 92
92 -
 93
93 -
 94
94 -
 95
95 -
 96
96 -
 97
97 -
 98
98 -
99
-
100
-
101
-
102
-
103
-
104
-
105
-
106
-
107
-
108
-
109
-
110
-
111
-
112
-
113
-
114
-
115
-
116
-
117
-
118
-
119
-
120
-
121
-
122
-
123
-
124
-
125
-
126
-
127
-
128
-
129
-
130
-
131
-
132
-
133
-
134
-
135
-
136
-
137
-
138
-
139
-
140
-
141
-
142
-
143
-
144
-
145
-
146
-
147
-
148
-
149
-
150
-
151
-
152
-
153
-
154
-
155
-
156
-
157
-
158
-
159
 |
 |

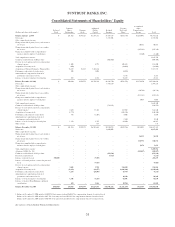
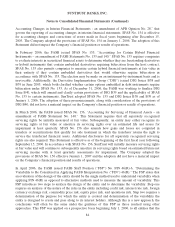
SUNTRUST BANKS, INC.
Consolidated Statements of Shareholders’ Equity
(Dollars and shares in thousands)
Preferred
Stock
Common
Shares
Outstanding
Common
Stock
Additional
Paid in
Capital
Retained
Earnings
Treasury
Stock and
Other1
Accumulated
Other
Comprehensive
Income Total
Balance, January 1, 2004 $- 281,923 $294,163 $1,288,311 $7,149,118 ($664,518) $1,664,092 $9,731,166
Net income - - - - 1,572,901 - - 1,572,901
Other comprehensive income:
Change in unrealized gains (losses) on derivatives,
net of taxes - - - - - - 10,661 10,661
Change in unrealized gains (losses) on securities,
net of taxes - - - - - - (395,343) (395,343)
Change in accumulated other comprehensive
income related to employee benefit plans - - - - - - (2,460) (2,460)
Total comprehensive income 1,185,759
Common stock dividends, $2.00 per share - - - - (603,309) - - (603,309)
Exercise of stock options and stock compensation
element expense - 1,905 - 8,775 - 105,125 - 113,900
Acquisition of treasury stock - (200) - - - (14,064) - (14,064)
Acquisition of National Commerce Financial, Inc. - 76,415 76,415 5,441,136 - - - 5,517,551
Performance and restricted stock activity - 302 - 2,099 - (2,099) - -
Amortization of compensation element of
performance and restricted stock - - - - - 8,515 - 8,515
Issuance of stock for employee benefit plans - 495 - 8,898 - 38,483 - 47,381
Balance, December 31, 2004 $- 360,840 $370,578 $6,749,219 $8,118,710 ($528,558) $1,276,950 $15,986,899
Net income - - - - 1,987,239 - - 1,987,239
Other comprehensive income:
Change in unrealized gains (losses) on derivatives,
net of taxes - - - - - - (10,744) (10,744)
Change in unrealized gains (losses) on securities,
net of taxes - - - - - - (332,183) (332,183)
Change in accumulated other comprehensive
income related to employee benefit plans - - - - - - 4,068 4,068
Total comprehensive income 1,648,380
Common stock dividends, $2.20 per share - - - - (794,971) - - (794,971)
Exercise of stock options and stock compensation
element expense - 2,663 - 13,438 - 147,802 - 161,240
Acquisition of treasury stock - (2,775) - - - (196,396) - (196,396)
Performance and restricted stock activity - 143 - (2,907) - 9,606 - 6,699
Amortization of compensation element of
performance and restricted stock - - - - - 9,190 - 9,190
Issuance of stock for employee benefit plans - 1,113 - 1,795 - 64,420 - 66,215
Other activity - - - 139 - - - 139
Balance, December 31, 2005 $- 361,984 $370,578 $6,761,684 $9,310,978 ($493,936) $938,091 $16,887,395
Net income - - - - 2,117,471 - - 2,117,471
Other comprehensive income:
Change in unrealized gains (losses) on derivatives,
net of taxes - - - - - - 36,235 36,235
Change in unrealized gains (losses) on securities,
net of taxes - - - - - - 330,771 330,771
Change in accumulated other comprehensive
income related to employee benefit plans - - - - - - 5,879 5,879
Total comprehensive income - - - - - - - 2,490,356
Adoption of SFAS No. 158 - - - - - - (385,027) (385,027)
Common stock dividends, $2.44 per share - - - - (879,568) - - (879,568)
Preferred stock dividends - - - - (7,729) - - (7,729)
Issuance of preferred stock 500,000 - - (7,705) - - - 492,295
Issuance of forward purchase contract for preferred
stock - - - (9,416) - - - (9,416)
Exercise of stock options and stock compensation
element expense - 3,481 - 9,710 - 226,858 - 236,568
Acquisition of treasury stock - (13,102) - (98,877) - (1,006,166) - (1,105,043)
Performance and restricted stock activity - 1,196 - (24,503) - 18,770 - (5,733)
Amortization of compensation element of
performance and restricted stock - - - - - 18,340 - 18,340
Issuance of stock for employee benefit plans - 1,141 - (5,913) - 72,081 - 66,168
Issuance of stock for BancMortgage contingent
consideration - 203 - 2,216 - 12,784 - 15,000
Balance, December 31, 2006 $500,000 354,903 $370,578 $6,627,196 $10,541,152 ($1,151,269) $925,949 $17,813,606
1 Balance at December 31, 2006 includes $1,090,782 for treasury stock and $60,487 for compensation element of restricted stock.
Balance at December 31, 2005 includes $467,714 for treasury stock and $26,222 for compensation element of restricted stock.
Balance at December 31, 2004 includes $492,047 for treasury stock and $36,511 for compensation element of restricted stock.
See notes to Consolidated Financial Statements.
75