SunTrust 2006 Annual Report Download - page 53
Download and view the complete annual report
Please find page 53 of the 2006 SunTrust annual report below. You can navigate through the pages in the report by either clicking on the pages listed below, or by using the keyword search tool below to find specific information within the annual report.-
 1
1 -
2
-
3
-
4
-
5
-
6
-
7
-
8
-
9
-
10
-
11
-
12
-
13
-
14
-
15
-
16
-
17
-
18
-
19
-
20
-
21
-
22
-
23
-
24
-
25
-
26
-
27
-
28
-
29
-
30
-
31
-
32
-
33
-
34
-
35
-
36
-
37
-
38
-
39
-
40
-
41
-
42
-
 43
43 -
 44
44 -
 45
45 -
 46
46 -
 47
47 -
 48
48 -
 49
49 -
 50
50 -
 51
51 -
 52
52 -
 53
53 -
 54
54 -
 55
55 -
 56
56 -
 57
57 -
 58
58 -
 59
59 -
 60
60 -
 61
61 -
 62
62 -
 63
63 -
64
-
65
-
66
-
67
-
68
-
69
-
70
-
71
-
72
-
73
-
74
-
75
-
76
-
77
-
78
-
79
-
80
-
81
-
82
-
83
-
84
-
85
-
86
-
87
-
88
-
89
-
90
-
91
-
92
-
93
-
94
-
95
-
96
-
97
-
98
-
99
-
100
-
101
-
102
-
103
-
104
-
105
-
106
-
107
-
108
-
109
-
110
-
111
-
112
-
113
-
114
-
115
-
116
-
117
-
118
-
119
-
120
-
121
-
122
-
123
-
124
-
125
-
126
-
127
-
128
-
129
-
130
-
131
-
132
-
133
-
134
-
135
-
136
-
137
-
138
-
139
-
140
-
141
-
142
-
143
-
144
-
145
-
146
-
147
-
148
-
149
-
150
-
151
-
152
-
153
-
154
-
155
-
156
-
157
-
158
-
159
 |
 |

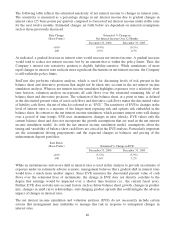
The following table reflects the estimated sensitivity of net interest income to changes in interest rates.
The sensitivity is measured as a percentage change in net interest income due to gradual changes in
interest rates (25 basis points per quarter) compared to forecasted net interest income under stable rates
for the next twelve months. Estimated changes set forth below are dependent on material assumptions
such as those previously discussed.
Rate Change
(Basis Points)
Estimated % Change in
Net Interest Income Over 12 Months
December 31, 2006 December 31, 2005
+100 (0.4%) (0.1%)
-100 0.9% 0.7%
As indicated, a gradual decrease in interest rates would increase net interest income. A gradual increase
would tend to reduce net interest income, but by an amount that is within the policy limits. Thus, the
Company’s interest rate sensitivity position is slightly liability-sensitive. While simulations of more
rapid changes in interest rates indicate more significant fluctuations in net interest income, the Company
is still within the policy limits.
SunTrust also performs valuation analysis, which is used for discerning levels of risk present in the
balance sheet and derivative positions that might not be taken into account in the net interest income
simulation analysis. Whereas net interest income simulation highlights exposures over a relatively short
time horizon, valuation analysis incorporates all cash flows over the estimated remaining life of all
balance sheet and derivative positions. The valuation of the balance sheet, at a point in time, is defined
as the discounted present value of asset cash flows and derivative cash flows minus the discounted value
of liability cash flows, the net of which is referred to as “EVE.” The sensitivity of EVE to changes in the
level of interest rates is a measure of the longer-term repricing risk and options risk embedded in the
balance sheet. In contrast to the net interest income simulation, which assumes interest rates will change
over a period of time (ramp), EVE uses instantaneous changes in rates (shock). EVE values only the
current balance sheet and does not incorporate the growth assumptions that are used in the net interest
income simulation model. As with the net interest income simulation model, assumptions about the
timing and variability of balance sheet cash flows are critical in the EVE analysis. Particularly important
are the assumptions driving prepayments and the expected changes in balances and pricing of the
indeterminate deposit portfolios.
Rate Shock
(Basis Points) Estimated % Change in EVE
December 31, 2006 December 31, 2005
+100 (5.5%) (5.9%)
-100 3.6% 3.2%
While an instantaneous and severe shift in interest rates is used in this analysis to provide an estimate of
exposure under an extremely adverse scenario, management believes that a gradual shift in interest rates
would have a much more modest impact. Since EVE measures the discounted present value of cash
flows over the estimated lives of instruments, the change in EVE does not directly correlate to the
degree that earnings would be impacted over a shorter time horizon (i.e., the current fiscal year).
Further, EVE does not take into account factors such as future balance sheet growth, changes in product
mix, changes in yield curve relationships, and changing product spreads that could mitigate the adverse
impact of changes in interest rates.
The net interest income simulation and valuation analyses (EVE) do not necessarily include certain
actions that management may undertake to manage this risk in response to anticipated changes in
interest rates.
40