SunTrust 2006 Annual Report Download - page 104
Download and view the complete annual report
Please find page 104 of the 2006 SunTrust annual report below. You can navigate through the pages in the report by either clicking on the pages listed below, or by using the keyword search tool below to find specific information within the annual report.-
 1
1 -
2
-
3
-
4
-
5
-
6
-
7
-
8
-
9
-
10
-
11
-
12
-
13
-
14
-
15
-
16
-
17
-
18
-
19
-
20
-
21
-
22
-
23
-
24
-
25
-
26
-
27
-
28
-
29
-
30
-
31
-
32
-
33
-
34
-
35
-
36
-
37
-
38
-
39
-
40
-
41
-
42
-
43
-
44
-
45
-
46
-
47
-
48
-
49
-
50
-
51
-
52
-
53
-
54
-
55
-
56
-
57
-
58
-
59
-
60
-
61
-
62
-
63
-
64
-
65
-
66
-
67
-
68
-
69
-
70
-
71
-
72
-
73
-
74
-
75
-
76
-
77
-
78
-
79
-
80
-
81
-
82
-
83
-
84
-
85
-
86
-
87
-
88
-
89
-
90
-
91
-
92
-
93
-
 94
94 -
 95
95 -
 96
96 -
 97
97 -
 98
98 -
 99
99 -
 100
100 -
 101
101 -
 102
102 -
 103
103 -
 104
104 -
 105
105 -
 106
106 -
 107
107 -
 108
108 -
 109
109 -
 110
110 -
 111
111 -
 112
112 -
 113
113 -
 114
114 -
115
-
116
-
117
-
118
-
119
-
120
-
121
-
122
-
123
-
124
-
125
-
126
-
127
-
128
-
129
-
130
-
131
-
132
-
133
-
134
-
135
-
136
-
137
-
138
-
139
-
140
-
141
-
142
-
143
-
144
-
145
-
146
-
147
-
148
-
149
-
150
-
151
-
152
-
153
-
154
-
155
-
156
-
157
-
158
-
159
 |
 |

SUNTRUST BANKS, INC.
Notes to Consolidated Financial Statements (Continued)
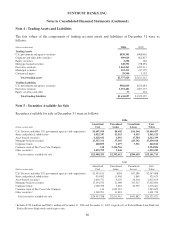
The amortized cost and fair value of investments in debt securities at December 31, 2006 by estimated
average life are shown below. Actual cash flows will differ from estimated average lives and contractual
maturities because borrowers may have the right to call or prepay obligations with or without call or
prepayment penalties.
(Dollars in thousands)
Amortized
Cost
Fair
Value
Due in one year or less $795,695 $794,526
Due in one year through five years 14,469,341 14,255,797
Due after five years through ten years 5,614,874 5,597,187
After ten years 694,534 700,134
Total $21,574,444 $21,347,644
Proceeds from the sale of investments in debt securities were $4.9 billion, $4.4 billion and $8.9 billion
in 2006, 2005 and 2004, respectively. Gross realized gains were $69.4 million, $21.7 million, and $16.5
million and gross realized losses on such sales were $119.9 million, $28.8 million, and $58.2 million in
2006, 2005, and 2004, respectively. Securities available for sale that were pledged to secure public
deposits, trusts and other funds had fair values of $16.8 billion, $18.1 billion, and $17.4 billion at
December 31, 2006, 2005, and 2004, respectively.
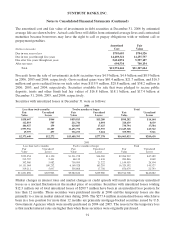
Securities with unrealized losses at December 31 were as follows:
2006
Less than twelve months Twelve months or longer Total
Fair
Value
Unrealized
Losses
Fair
Value
Unrealized
Losses
Fair
Value
Unrealized
Losses
$138,467 $864 $859,815 $15,280 $998,282 $16,144
112,893 545 211,746 4,094 324,639 4,639
104,927 159 629,867 17,425 734,794 17,584
1,997,556 10,207 11,651,772 233,555 13,649,328 243,762
19,797 497 336,193 7,024 355,990 7,521
$2,373,640 $12,272 $13,689,393 $277,378 $16,063,033 $289,650
2005
Less than twelve months Twelve months or longer Total
Fair
Value
Unrealized
Losses
Fair
Value
Unrealized
Losses
Fair
Value
Unrealized
Losses
$752,954 $11,120 $1,531,278 $36,269 $2,284,232 $47,389
215,707 2,431 68,139 1,438 283,846 3,869
392,960 5,082 756,999 21,222 1,149,959 26,304
10,151,064 180,232 6,169,528 163,295 16,320,592 343,527
319,211 5,037 556,868 17,756 876,079 22,793
$11,831,896 $203,902 $9,082,812 $239,980 $20,914,708 $443,882
Market changes in interest rates and market changes in credit spreads will result in temporary unrealized
losses as a normal fluctuation in the market price of securities. Securities with unrealized losses totaling
$12.3 million out of total unrealized losses of $289.7 million have been in an unrealized loss position for
less than 12 months. These securities were purchased mostly in 2006 and the temporary losses are due
primarily to a rise in market interest rates during 2006. The $277.4 million in unrealized losses which have
been in a loss position for more than 12 months are primarily mortgage-backed securities issued by U.S.
Government Agencies which were mostly purchased in 2004 and 2005. The reason for the temporary loss
is that market interest rates are higher than when these securities were originally purchased.
91