SunTrust 2006 Annual Report Download - page 33
Download and view the complete annual report
Please find page 33 of the 2006 SunTrust annual report below. You can navigate through the pages in the report by either clicking on the pages listed below, or by using the keyword search tool below to find specific information within the annual report.-
 1
1 -
2
-
3
-
4
-
5
-
6
-
7
-
8
-
9
-
10
-
11
-
12
-
13
-
14
-
15
-
16
-
17
-
18
-
19
-
20
-
21
-
22
-
 23
23 -
 24
24 -
 25
25 -
 26
26 -
 27
27 -
 28
28 -
 29
29 -
 30
30 -
 31
31 -
 32
32 -
 33
33 -
 34
34 -
 35
35 -
 36
36 -
 37
37 -
 38
38 -
 39
39 -
 40
40 -
 41
41 -
 42
42 -
 43
43 -
44
-
45
-
46
-
47
-
48
-
49
-
50
-
51
-
52
-
53
-
54
-
55
-
56
-
57
-
58
-
59
-
60
-
61
-
62
-
63
-
64
-
65
-
66
-
67
-
68
-
69
-
70
-
71
-
72
-
73
-
74
-
75
-
76
-
77
-
78
-
79
-
80
-
81
-
82
-
83
-
84
-
85
-
86
-
87
-
88
-
89
-
90
-
91
-
92
-
93
-
94
-
95
-
96
-
97
-
98
-
99
-
100
-
101
-
102
-
103
-
104
-
105
-
106
-
107
-
108
-
109
-
110
-
111
-
112
-
113
-
114
-
115
-
116
-
117
-
118
-
119
-
120
-
121
-
122
-
123
-
124
-
125
-
126
-
127
-
128
-
129
-
130
-
131
-
132
-
133
-
134
-
135
-
136
-
137
-
138
-
139
-
140
-
141
-
142
-
143
-
144
-
145
-
146
-
147
-
148
-
149
-
150
-
151
-
152
-
153
-
154
-
155
-
156
-
157
-
158
-
159
 |
 |

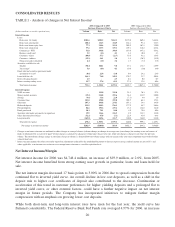
CONSOLIDATED RESULTS
TABLE 1 - Analysis of changes in Net Interest Income1
2006 Compared to 2005
Increase (Decrease) Due to
2005 Compared to 2004
Increase (Decrease) Due to
(Dollars in millions on a taxable-equivalent basis) Volume Rate Net Volume Rate Net
Interest Income
Loans:
Real estate 1-4 family $382.6 $180.5 $563.1 $375.0 $69.4 $444.4
Real estate construction 188.4 136.5 324.9 226.1 97.4 323.5
Real estate home equity lines 77.3 214.6 291.9 202.9 167.1 370.0
Real estate commercial 57.6 117.5 175.1 129.2 116.2 245.4
Commercial - FTE251.8 346.8 398.6 167.0 387.2 554.2
Business credit card 5.5 (1.2) 4.3 4.4 (0.2) 4.2
Consumer - direct (80.0) 57.3 (22.7) 73.6 41.2 114.8
Consumer - indirect (25.1) 26.1 1.0 1.8 (26.7) (24.9)
Nonaccrual and restructured 4.4 (1.0) 3.4 1.5 (7.3) (5.8)
Securities available for sale:
Taxable (98.3) 108.1 9.8 87.2 132.7 219.9
Tax-exempt 25.0 (0.9) 4.1 15.0 (1.0) 14.0
Funds sold and securities purchased under
agreements to resell (8.6) 22.4 13.8 0.4 24.2 24.6
Loans held for sale 166.3 76.0 242.3 170.7 33.7 204.4
Interest-bearing deposits 2.5 - 2.5 0.1 0.6 0.7
Interest earning trading assets 23.7 37.4 61.1 27.8 12.8 40.6
Total interest income 753.1 1,320.1 2,073.2 1,482.7 1,047.3 2,530.0
Interest Expense
NOW accounts - 139.0 139.0 21.5 76.3 97.8
Money market accounts (19.2) 214.8 195.6 26.1 213.9 240.0
Savings (9.6) 31.6 22.0 (7.3) 8.9 1.6
Consumer time 101.0 158.8 259.8 108.5 64.3 172.8
Other time 147.3 106.8 254.1 107.1 38.8 145.9
Brokered deposits 321.9 204.2 526.1 177.9 88.7 266.6
Foreign deposits 84.6 150.6 235.2 17.4 124.6 142.0
Funds purchased 20.3 74.1 94.4 1.0 79.6 80.6
Securities sold under agreements to repurchase 19.9 116.6 136.5 4.9 118.1 123.0
Other short-term borrowings (52.1) 47.0 (5.1) 22.9 41.9 64.8
Long-term debt (143.9) 265.6 121.7 140.0 144.0 284.0
Total interest expense 470.2 1,509.1 1,979.3 620.0 999.1 1,619.1
Net change in net interest income $282.9 ($189.0) $93.9 $862.7 $48.2 $910.9
1Changes in net interest income are attributed to either changes in average balances (volume change) or changes in average rates (rate change) for earning assets and sources of
funds on which interest is received or paid. Volume change is calculated as change in volume times the previous rate, while rate change is change in rate times the previous
volume. The rate/volume change, change in rate times change in volume, is allocated between volume change and rate change at the ratio each component bears to the absolute
value of their total.
2Interest income includes the effects of taxable-equivalent adjustments (reduced by the nondeductible portion of interest expense) using a federal income tax rate of 35% and,
where applicable, state income taxes to increase tax-exempt interest income to a taxable-equivalent basis.
Net Interest Income/Margin
Net interest income for 2006 was $4,748.4 million, an increase of $93.9 million, or 2.0%, from 2005.
Net interest income benefited from strong earning asset growth, in particular, loans and loans held for
sale.
The net interest margin decreased 17 basis points to 3.00% in 2006 due to spread compression from the
continued flat to inverted yield curve. An overall decline in low cost deposits, as well as a shift in the
deposit mix to higher cost certificates of deposit also contributed to the decrease. Continuation or
acceleration of this trend in customer preferences for higher yielding deposits and a prolonged flat to
inverted yield curve, or other external factors, could have a further negative impact on net interest
margin in future periods. The Company has incorporated initiatives to mitigate further margin
compression with an emphasis on growing lower cost deposits.
While both short-term and long-term interest rates have risen for the last year, the yield curve has
flattened considerably. The Federal Reserve Bank Fed Funds rate averaged 4.97% for 2006, an increase
20