SunTrust 2006 Annual Report Download - page 37
Download and view the complete annual report
Please find page 37 of the 2006 SunTrust annual report below. You can navigate through the pages in the report by either clicking on the pages listed below, or by using the keyword search tool below to find specific information within the annual report.-
 1
1 -
2
-
3
-
4
-
5
-
6
-
7
-
8
-
9
-
10
-
11
-
12
-
13
-
14
-
15
-
16
-
17
-
18
-
19
-
20
-
21
-
22
-
23
-
24
-
25
-
26
-
 27
27 -
 28
28 -
 29
29 -
 30
30 -
 31
31 -
 32
32 -
 33
33 -
 34
34 -
 35
35 -
 36
36 -
 37
37 -
 38
38 -
 39
39 -
 40
40 -
 41
41 -
 42
42 -
 43
43 -
 44
44 -
 45
45 -
 46
46 -
 47
47 -
48
-
49
-
50
-
51
-
52
-
53
-
54
-
55
-
56
-
57
-
58
-
59
-
60
-
61
-
62
-
63
-
64
-
65
-
66
-
67
-
68
-
69
-
70
-
71
-
72
-
73
-
74
-
75
-
76
-
77
-
78
-
79
-
80
-
81
-
82
-
83
-
84
-
85
-
86
-
87
-
88
-
89
-
90
-
91
-
92
-
93
-
94
-
95
-
96
-
97
-
98
-
99
-
100
-
101
-
102
-
103
-
104
-
105
-
106
-
107
-
108
-
109
-
110
-
111
-
112
-
113
-
114
-
115
-
116
-
117
-
118
-
119
-
120
-
121
-
122
-
123
-
124
-
125
-
126
-
127
-
128
-
129
-
130
-
131
-
132
-
133
-
134
-
135
-
136
-
137
-
138
-
139
-
140
-
141
-
142
-
143
-
144
-
145
-
146
-
147
-
148
-
149
-
150
-
151
-
152
-
153
-
154
-
155
-
156
-
157
-
158
-
159
 |
 |

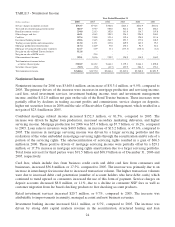
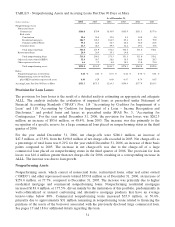
TABLE 3 - Noninterest Income
Year Ended December 31
(Dollars in millions) 2006 2005 2004 2003 2002 2001
Service charges on deposit accounts $763.7 $772.5 $700.0 $643.1 $612.9 $510.2
Trust and investment management income 686.9 673.7 586.8 502.4 504.5 486.1
Retail investment services 234.0 213.3 192.8 161.8 136.7 107.8
Other charges and fees 462.1 456.5 390.5 326.3 296.9 240.3
Card fees 247.6 210.8 153.4 119.6 120.0 113.6
Investment banking income 230.6 216.5 206.7 192.5 177.0 108.5
Trading account profits and commissions 113.0 145.1 127.8 109.9 103.2 95.7
Mortgage production related income 217.4 144.9 57.8 150.1 92.3 82.2
Mortgage servicing related income (expense) 121.7 41.9 11.1 (177.5) (110.1) (6.1)
Net gain on sale of Bond Trustee business 112.8 -----
Net gain on sale of RCM assets -23.4 ----
Other noninterest income 329.1 263.6 219.2 150.9 130.9 160.5
Total noninterest income before
securities (losses)/gains 3,518.9 3,162.2 2,646.1 2,179.1 2,064.3 1,898.8
Securities (losses)/gains (50.5) (7.2) (41.7) 123.9 204.5 153.1
Total noninterest income $3,468.4 $3,155.0 $2,604.4 $2,303.0 $2,268.8 $2,051.9
Noninterest Income
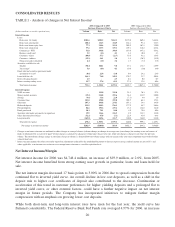
Noninterest income for 2006 was $3,468.4 million, an increase of $313.4 million, or 9.9%, compared to
2005. The primary drivers of the increase were increases in mortgage production and servicing income,
card fees, retail investment services, investment banking income, trust and investment management
income, and the $112.8 million net gain on the sale of the Bond Trustee business. These increases were
partially offset by declines in trading account profits and commissions, service charges on deposits,
higher net securities losses in 2006 and the sale of Receivables Capital Management, which resulted in a
net gain of $23.4 million in 2005.
Combined mortgage related income increased $152.3 million, or 81.5%, compared to 2005. The
increase was driven by higher loan production, increased secondary marketing deliveries, and higher
servicing income. Mortgage production for 2006 was $55.4 billion, up $7.7 billion, or 16.2%, compared
to 2005. Loan sales to investors were $40.9 billion, an increase of $13.2 billion, or 47.6%, compared to
2005. The increase in mortgage servicing income was driven by a larger servicing portfolio and the
realization of the value embedded in mortgage servicing rights through the securitization and/or sale of a
portion of the servicing rights. The sale/securitization of servicing rights resulted in a gain of $66.3
million in 2006. These positive drivers of mortgage servicing income were partially offset by a $29.1
million, or 17.5% increase in mortgage servicing rights amortization due to a larger servicing portfolio.
Total loans serviced for third parties were $91.5 billion and $68.9 billion as of December 31, 2006 and
2005, respectively.
Card fees, which include fees from business credit cards and debit card fees from consumers and
businesses, increased $36.8 million, or 17.5%, compared to 2005. The increase was primarily due to an
increase in interchange fee income due to increased transaction volume. The higher transaction volumes
were due to increased debit card penetration (number of account holders who have debit cards) which
continued to trend upward as consumers increased the use of this form of payment. Service charges on
deposit accounts decreased $8.8 million, or 1.1%, due to a decline in consumer NSF fees as well as
customer migration from fee based checking products to free checking account products.
Retail investment services increased $20.7 million, or 9.7%, compared to 2005. The increase was
attributable to improvements in annuity, managed account and new business revenues.
Investment banking income increased $14.1 million, or 6.5%, compared to 2005. The increase was
driven by strong debt capital markets revenue in the securitization, structured leasing and loan
24