Chrysler 2010 Annual Report Download - page 86
Download and view the complete annual report
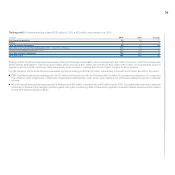
Please find page 86 of the 2010 Chrysler annual report below. You can navigate through the pages in the report by either clicking on the pages listed below, or by using the keyword search tool below to find specific information within the annual report.-
 1
1 -
2
-
3
-
4
-
5
-
6
-
7
-
8
-
9
-
10
-
11
-
12
-
13
-
14
-
15
-
16
-
17
-
18
-
19
-
20
-
21
-
22
-
23
-
24
-
25
-
26
-
27
-
28
-
29
-
30
-
31
-
32
-
33
-
34
-
35
-
36
-
37
-
38
-
39
-
40
-
41
-
42
-
43
-
44
-
45
-
46
-
47
-
48
-
49
-
50
-
51
-
52
-
53
-
54
-
55
-
56
-
57
-
58
-
59
-
60
-
61
-
62
-
63
-
64
-
65
-
66
-
67
-
68
-
69
-
70
-
71
-
72
-
73
-
74
-
75
-
 76
76 -
 77
77 -
 78
78 -
 79
79 -
 80
80 -
 81
81 -
 82
82 -
 83
83 -
 84
84 -
 85
85 -
 86
86 -
 87
87 -
 88
88 -
 89
89 -
 90
90 -
 91
91 -
 92
92 -
 93
93 -
 94
94 -
 95
95 -
 96
96 -
97
-
98
-
99
-
100
-
101
-
102
-
103
-
104
-
105
-
106
-
107
-
108
-
109
-
110
-
111
-
112
-
113
-
114
-
115
-
116
-
117
-
118
-
119
-
120
-
121
-
122
-
123
-
124
-
125
-
126
-
127
-
128
-
129
-
130
-
131
-
132
-
133
-
134
-
135
-
136
-
137
-
138
-
139
-
140
-
141
-
142
-
143
-
144
-
145
-
146
-
147
-
148
-
149
-
150
-
151
-
152
-
153
-
154
-
155
-
156
-
157
-
158
-
159
-
160
-
161
-
162
-
163
-
164
-
165
-
166
-
167
-
168
-
169
-
170
-
171
-
172
-
173
-
174
-
175
-
176
-
177
-
178
-
179
-
180
-
181
-
182
-
183
-
184
-
185
-
186
-
187
-
188
-
189
-
190
-
191
-
192
-
193
-
194
-
195
-
196
-
197
-
198
-
199
-
200
-
201
-
202
-
203
-
204
-
205
-
206
-
207
-
208
-
209
-
210
-
211
-
212
-
213
-
214
-
215
-
216
-
217
-
218
-
219
-
220
-
221
-
222
-
223
-
224
-
225
-
226
-
227
-
228
-
229
-
230
-
231
-
232
-
233
-
234
-
235
-
236
-
237
-
238
-
239
-
240
-
241
-
242
-
243
-
244
-
245
-
246
-
247
-
248
-
249
-
250
-
251
-
252
-
253
-
254
-
255
-
256
-
257
-
258
-
259
-
260
-
261
-
262
-
263
-
264
-
265
-
266
-
267
-
268
-
269
-
270
-
271
-
272
-
273
-
274
-
275
-
276
-
277
-
278
-
279
-
280
-
281
-
282
-
283
-
284
-
285
-
286
-
287
-
288
-
289
-
290
-
291
-
292
-
293
-
294
-
295
-
296
-
297
-
298
-
299
-
300
-
301
-
302
-
303
-
304
-
305
-
306
-
307
-
308
-
309
-
310
-
311
-
312
-
313
-
314
-
315
-
316
-
317
-
318
-
319
-
320
-
321
-
322
-
323
-
324
-
325
-
326
-
327
-
328
-
329
-
330
-
331
-
332
-
333
-
334
-
335
-
336
-
337
-
338
-
339
-
340
-
341
-
342
-
343
-
344
-
345
-
346
-
347
-
348
-
349
-
350
-
351
-
352
-
353
-
354
-
355
-
356
-
357
-
358
-
359
-
360
-
361
-
362
-
363
-
364
-
365
-
366
-
367
-
368
-
369
-
370
-
371
-
372
-
373
-
374
-
375
-
376
-
377
-
378
-
379
-
380
-
381
-
382
-
383
-
384
-
385
-
386
-
387
-
388
-
389
-
390
-
391
-
392
-
393
-
394
-
395
-
396
-
397
-
398
-
399
-
400
-
401
-
402
 |
 |

85
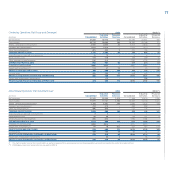
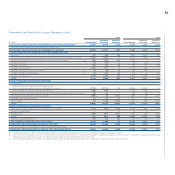
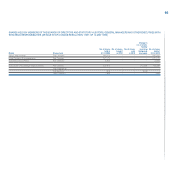
Statement of Cash Flows for Fiat Group pre Demerger by Activity
2010 2009
Industrial Financial Industrial Financial
(€ million) Consolidated Activities Services Consolidated Activities Services
A) CASH AND CASH EQUIVALENTS AT BEGINNING OF THE YEAR (AS REPORTED) 12,226 10,819 1,407 3,683 2,604 1,079
Cash and cash equivalents included under Assets held for sale - - - - - -
B) CASH AND CASH EQUIVALENTS AT BEGINNING OF THE YEAR 12,226 10,819 1,407 3,683 2,604 1,079
C)
CASH FROM/(USED IN) OPERATING ACTIVITIES DURING THE YEAR:
Profit/(loss) 600 600 182 (848) (848) 158
Amortization and depreciation (net of vehicles sold under buy-back commitments or leased) 2,851 2,846 5 2,673 2,667 6
(Gains)/losses on disposal of non-current assets and other non-cash items (a) 266 (130) 214 343 8 177
Dividends received 94 419 5 53 183 15
Change in provisions 405 413 (8) 96 171 (75)
Change in deferred taxes (169) (172) 3 (179) (188) 9
Changes relating to buy-back commitments (b) 44 36 8 (58) (59) 1
Changes relating to operating leases (c) 26 (14) 40 (41) 3 (44)
Change in working capital 1,993 1,886 107 2,562 2,564 (2)
TOTAL 6,110 5,884 556 4,601 4,501 245
D)
CASH FROM/(USED IN) INVESTING ACTIVITIES:
Investments in:
Property, plant and equipment and intangible assets
(net of vehicles sold under buy-back commitments or leased) (3,718) (3,712) (6) (3,386) (3,382) (4)
Unconsolidated subsidiaries and other investments (288) (365) - (105) (105) -
Proceeds from the sale of non-current assets (net of vehicles sold under buy-back commitments) 88 87 1 108 105 3
Net change in receivables from financing activities (259) (5) (254) 882 39 843
Change in other current securities 42 43 (1) (27) (30) 3
Other changes 182 1,580 (1,398) (31) 1,395 (1,426)
TOTAL (3,953) (2,372) (1,658) (2,559) (1,978) (581)
E) CASH FROM/(USED IN) FINANCING ACTIVITIES:
Net change in financial payables and other financial assets/liabilities 1,149 (103) 1,252 6,295 5,602 693
Increase in share capital 1 1 77 13 13 -
Dividends paid (239) (239) (330) (27) (33) (139)
TOTAL 911 (341) 999 6,281 5,582 554
Currency translation differences 359 215 144 220 110 110
F) NET CHANGE IN CASH AND CASH EQUIVALENTS 3.427 3,386 41 8,543 8,215 328
G)
CASH AND CASH EQUIVALENTS AT END OF THE YEAR 15,653 14,205 1,448 12,226 10,819 1,407
of which: Cash and cash equivalents included under Assets held for sale - - - - - -
H)
CASH AND CASH EQUIVALENTS AT END OF THE YEAR (AS REPORTED) 15,653 14,205 1,448 12,226 10,819 1,407
(a) Includes the reversal of a €107 million gain (€117 million loss for 2009) in the fair value of two stock-option related swaps on Fiat S.p.A. shares
(b) Cash from vehicles sold under buy-back commitments for the periods reported above, net of amounts already recognized through the income statement, is included in a separate line item under
operating activities which also includes the change in working capital, capital expenditures and depreciation
(c) Cash from operating leases is stated in a separate line item, which also includes capital expenditures, depreciation, writedowns and change in inventory