Chrysler 2010 Annual Report Download - page 72
Download and view the complete annual report
Please find page 72 of the 2010 Chrysler annual report below. You can navigate through the pages in the report by either clicking on the pages listed below, or by using the keyword search tool below to find specific information within the annual report.-
 1
1 -
2
-
3
-
4
-
5
-
6
-
7
-
8
-
9
-
10
-
11
-
12
-
13
-
14
-
15
-
16
-
17
-
18
-
19
-
20
-
21
-
22
-
23
-
24
-
25
-
26
-
27
-
28
-
29
-
30
-
31
-
32
-
33
-
34
-
35
-
36
-
37
-
38
-
39
-
40
-
41
-
42
-
43
-
44
-
45
-
46
-
47
-
48
-
49
-
50
-
51
-
52
-
53
-
54
-
55
-
56
-
57
-
58
-
59
-
60
-
61
-
 62
62 -
 63
63 -
 64
64 -
 65
65 -
 66
66 -
 67
67 -
 68
68 -
 69
69 -
 70
70 -
 71
71 -
 72
72 -
 73
73 -
 74
74 -
 75
75 -
 76
76 -
 77
77 -
 78
78 -
 79
79 -
 80
80 -
 81
81 -
 82
82 -
83
-
84
-
85
-
86
-
87
-
88
-
89
-
90
-
91
-
92
-
93
-
94
-
95
-
96
-
97
-
98
-
99
-
100
-
101
-
102
-
103
-
104
-
105
-
106
-
107
-
108
-
109
-
110
-
111
-
112
-
113
-
114
-
115
-
116
-
117
-
118
-
119
-
120
-
121
-
122
-
123
-
124
-
125
-
126
-
127
-
128
-
129
-
130
-
131
-
132
-
133
-
134
-
135
-
136
-
137
-
138
-
139
-
140
-
141
-
142
-
143
-
144
-
145
-
146
-
147
-
148
-
149
-
150
-
151
-
152
-
153
-
154
-
155
-
156
-
157
-
158
-
159
-
160
-
161
-
162
-
163
-
164
-
165
-
166
-
167
-
168
-
169
-
170
-
171
-
172
-
173
-
174
-
175
-
176
-
177
-
178
-
179
-
180
-
181
-
182
-
183
-
184
-
185
-
186
-
187
-
188
-
189
-
190
-
191
-
192
-
193
-
194
-
195
-
196
-
197
-
198
-
199
-
200
-
201
-
202
-
203
-
204
-
205
-
206
-
207
-
208
-
209
-
210
-
211
-
212
-
213
-
214
-
215
-
216
-
217
-
218
-
219
-
220
-
221
-
222
-
223
-
224
-
225
-
226
-
227
-
228
-
229
-
230
-
231
-
232
-
233
-
234
-
235
-
236
-
237
-
238
-
239
-
240
-
241
-
242
-
243
-
244
-
245
-
246
-
247
-
248
-
249
-
250
-
251
-
252
-
253
-
254
-
255
-
256
-
257
-
258
-
259
-
260
-
261
-
262
-
263
-
264
-
265
-
266
-
267
-
268
-
269
-
270
-
271
-
272
-
273
-
274
-
275
-
276
-
277
-
278
-
279
-
280
-
281
-
282
-
283
-
284
-
285
-
286
-
287
-
288
-
289
-
290
-
291
-
292
-
293
-
294
-
295
-
296
-
297
-
298
-
299
-
300
-
301
-
302
-
303
-
304
-
305
-
306
-
307
-
308
-
309
-
310
-
311
-
312
-
313
-
314
-
315
-
316
-
317
-
318
-
319
-
320
-
321
-
322
-
323
-
324
-
325
-
326
-
327
-
328
-
329
-
330
-
331
-
332
-
333
-
334
-
335
-
336
-
337
-
338
-
339
-
340
-
341
-
342
-
343
-
344
-
345
-
346
-
347
-
348
-
349
-
350
-
351
-
352
-
353
-
354
-
355
-
356
-
357
-
358
-
359
-
360
-
361
-
362
-
363
-
364
-
365
-
366
-
367
-
368
-
369
-
370
-
371
-
372
-
373
-
374
-
375
-
376
-
377
-
378
-
379
-
380
-
381
-
382
-
383
-
384
-
385
-
386
-
387
-
388
-
389
-
390
-
391
-
392
-
393
-
394
-
395
-
396
-
397
-
398
-
399
-
400
-
401
-
402
 |
 |

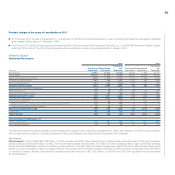
71
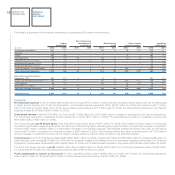
Discontinued Operations
Agricultural and Construction Equipment
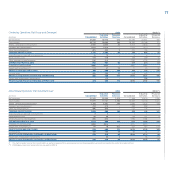
CNH – Case New Holland had a trading profit of €755 million (trading margin of 6.3%) for 2010, up €418 million from the €337 million (trading margin of
3.3%) for 2009, when performance was severely impacted by difficult trading conditions in the construction equipment segment. The improvement resulted
from higher volumes, increased industrial utilization in the Americas, a favorable shift in product mix to higher powered tractor and combine segments, as
well as better pricing and cost reductions from prior year restructuring initiatives. This positive performance was tempered by continued low demand levels
for agricultural equipment in Western Europe, increased raw material prices and new product launch costs, primarily in the construction equipment sector
during the fourth quarter.
Trucks and Commercial Vehicles
Iveco posted a trading profit of €270 million for the year (2009: €105 million), with a trading margin of 3.3% (2009: 1.5%). The improvement was primarily
driven by higher sales volumes and production efficiencies.
FPT Industrial
FPT Industrial closed 2010 with a trading profit of €65 million. The improvement over the €131 million trading loss reported for 2009 was principally
attributable to a significant increase in sales volumes.
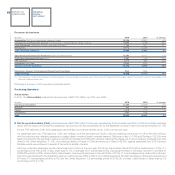
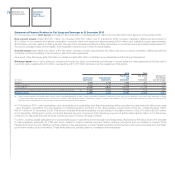
Operating profit/(loss)
For 2010, Fiat Group recorded operating profit of €2,009 million (€359 million in 2009), which included €195 million (€699 million in 2009) in net unusual
expenses, mainly due to restructuring costs (€176 million), inclusive of related asset write-offs. Operating profit for Continuing Operations was €992 million
(€378 million for 2009): the increase reflected the improvement in trading profit (+€376 million) and a reduction in net unusual expense (€120 million for
2010 compared with a €358 million charge for 2009). Operating profit for Discontinued Operations was €1,017 million: the increase over the €19 million
loss for 2009 was due to improved trading performance (+€770 million) and a reduction in net unusual expense (€75 million for 2010 compared with a
€341 million charge for 2009).
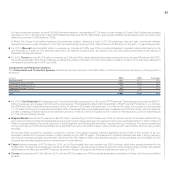
Net gains on the disposal of investments totaled €15 million (€4 million in 2009), with €12 million attributable to Continuing Operations (€3 million
in 2009), including €10 million relating to the accounting impact of the acquisition of the remaining 50% in Fiat-GM Powertrain Polska. Discontinued
Operations accounted for €3 million (€1 million in 2009), primarily related to the gain on the disposal of the interest in the joint venture LBX Company LLC
by the Agricultural and Construction Equipment sector.
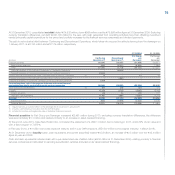
Restructuring costs for Fiat Group totaled €176 million (€312 million in 2009). For Continuing Operations, restructuring costs of €118 million primarily
related to Fiat Group Automobiles (€90 million) and Magneti Marelli (€26 million), compared to a total of €168 million for 2009, principally attributable to
Magneti Marelli (€62 million), Fiat Group Automobiles (€54 million) and Fiat Powertrain (€21 million). For Discontinued Operations, restructuring costs
totaled €58 million and primarily related to FPT Industrial (€33 million) and Iveco (€19 million), compared to a total of €144 million in 2009, mainly related
to CNH – Case New Holland (€87 million), FPT Industrial (€35 million) and Iveco (€22 million).
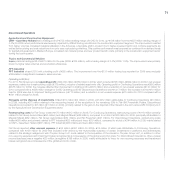
Fiat Group reported other unusual expense of €34 million (€391 million for 2009), €14 million of which was attributable to Continuing Operations,
compared with €193 million for 2009 that included write-downs by the Automobiles business of certain investments in platforms and architectures
related to the strategic realignment with Chrysler Group LLC, costs related to the acquisition of the interest in Chrysler Group LLC, in addition to other
non-recurring expenses and impairment losses recognized as a consequence of the global economic crisis. For Discontinued Operations, other unusual
income/(expense) was a negative €20 million (a negative €198 million in 2009, mainly attributable to Iveco for non-recurring expenses and impairment
losses recognized as a consequence of the global economic crisis).