Chrysler 2010 Annual Report Download - page 206
Download and view the complete annual report
Please find page 206 of the 2010 Chrysler annual report below. You can navigate through the pages in the report by either clicking on the pages listed below, or by using the keyword search tool below to find specific information within the annual report.-
 1
1 -
2
-
3
-
4
-
5
-
6
-
7
-
8
-
9
-
10
-
11
-
12
-
13
-
14
-
15
-
16
-
17
-
18
-
19
-
20
-
21
-
22
-
23
-
24
-
25
-
26
-
27
-
28
-
29
-
30
-
31
-
32
-
33
-
34
-
35
-
36
-
37
-
38
-
39
-
40
-
41
-
42
-
43
-
44
-
45
-
46
-
47
-
48
-
49
-
50
-
51
-
52
-
53
-
54
-
55
-
56
-
57
-
58
-
59
-
60
-
61
-
62
-
63
-
64
-
65
-
66
-
67
-
68
-
69
-
70
-
71
-
72
-
73
-
74
-
75
-
76
-
77
-
78
-
79
-
80
-
81
-
82
-
83
-
84
-
85
-
86
-
87
-
88
-
89
-
90
-
91
-
92
-
93
-
94
-
95
-
96
-
97
-
98
-
99
-
100
-
101
-
102
-
103
-
104
-
105
-
106
-
107
-
108
-
109
-
110
-
111
-
112
-
113
-
114
-
115
-
116
-
117
-
118
-
119
-
120
-
121
-
122
-
123
-
124
-
125
-
126
-
127
-
128
-
129
-
130
-
131
-
132
-
133
-
134
-
135
-
136
-
137
-
138
-
139
-
140
-
141
-
142
-
143
-
144
-
145
-
146
-
147
-
148
-
149
-
150
-
151
-
152
-
153
-
154
-
155
-
156
-
157
-
158
-
159
-
160
-
161
-
162
-
163
-
164
-
165
-
166
-
167
-
168
-
169
-
170
-
171
-
172
-
173
-
174
-
175
-
176
-
177
-
178
-
179
-
180
-
181
-
182
-
183
-
184
-
185
-
186
-
187
-
188
-
189
-
190
-
191
-
192
-
193
-
194
-
195
-
 196
196 -
 197
197 -
 198
198 -
 199
199 -
 200
200 -
 201
201 -
 202
202 -
 203
203 -
 204
204 -
 205
205 -
 206
206 -
 207
207 -
 208
208 -
 209
209 -
 210
210 -
 211
211 -
 212
212 -
 213
213 -
 214
214 -
 215
215 -
 216
216 -
217
-
218
-
219
-
220
-
221
-
222
-
223
-
224
-
225
-
226
-
227
-
228
-
229
-
230
-
231
-
232
-
233
-
234
-
235
-
236
-
237
-
238
-
239
-
240
-
241
-
242
-
243
-
244
-
245
-
246
-
247
-
248
-
249
-
250
-
251
-
252
-
253
-
254
-
255
-
256
-
257
-
258
-
259
-
260
-
261
-
262
-
263
-
264
-
265
-
266
-
267
-
268
-
269
-
270
-
271
-
272
-
273
-
274
-
275
-
276
-
277
-
278
-
279
-
280
-
281
-
282
-
283
-
284
-
285
-
286
-
287
-
288
-
289
-
290
-
291
-
292
-
293
-
294
-
295
-
296
-
297
-
298
-
299
-
300
-
301
-
302
-
303
-
304
-
305
-
306
-
307
-
308
-
309
-
310
-
311
-
312
-
313
-
314
-
315
-
316
-
317
-
318
-
319
-
320
-
321
-
322
-
323
-
324
-
325
-
326
-
327
-
328
-
329
-
330
-
331
-
332
-
333
-
334
-
335
-
336
-
337
-
338
-
339
-
340
-
341
-
342
-
343
-
344
-
345
-
346
-
347
-
348
-
349
-
350
-
351
-
352
-
353
-
354
-
355
-
356
-
357
-
358
-
359
-
360
-
361
-
362
-
363
-
364
-
365
-
366
-
367
-
368
-
369
-
370
-
371
-
372
-
373
-
374
-
375
-
376
-
377
-
378
-
379
-
380
-
381
-
382
-
383
-
384
-
385
-
386
-
387
-
388
-
389
-
390
-
391
-
392
-
393
-
394
-
395
-
396
-
397
-
398
-
399
-
400
-
401
-
402
 |
 |

205
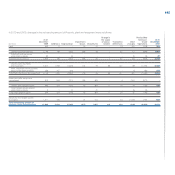
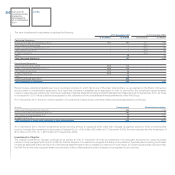
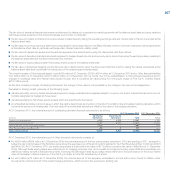
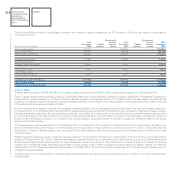
Receivables from financing activities are shown net of an allowance for doubtful accounts determined on the basis of specific insolvency risks. At 31
December 2010, the allowance referring to Continuing Operations amounts to €102 million (€450 million at 31 December 2009). Changes in the allowance
accounts during the year are as follows:
Reclassified to
At Use and other Discontinued At
(€ million) 31 December 2009 Provision changes Operations 31 December 2010
Allowance for receivables regarding:
Retail financing 230 192 (91) (310) 21
Finance leases 80 22 1 (94) 9
Dealer financing 90 52 (27) (89) 26
Supplier financing 4 - (2) - 2
Other 46 - (2) - 44
Total allowance on Receivables from financing activities 450 266 (121) (493) 102
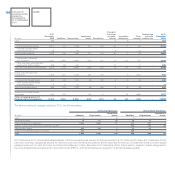
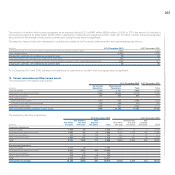
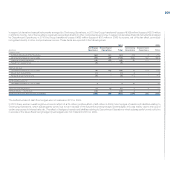
Finance lease receivables mainly relate to Discontinued Operations and refer to vehicles of the Trucks and Commercial Vehicles and Agricultural and
Construction Equipment sectors leased out under finance lease arrangements. The interest rate implicit in the lease is determined at the commencement of
the lease for the whole lease term. The average interest rate implicit in total finance lease receivables varies depending on prevailing market interest rates.
The item may be analysed as follows stated gross of an allowance of €103 million at 31 December 2010 (€80 million at 31 December 2009):
At 31 December 2010 At 31 December 2009
due between due due between due
due within one and beyond due within one and beyond
(€ million) one year five years five years Total one year five years five years Total
Receivables for future minimum
lease payments 540 674 100 1,314 560 731 76 1,367
Less: unrealised interest income (54) (82) (20) (156) (61) (104) (12) (177)
Present value of future minimum lease payments 486 592 80 1,158 499 627 64 1,190
No contingent rents were recognised as finance leases during 2010 or 2009 and unguaranteed residual values at 31 December 2010 and 2009 are
not significant.
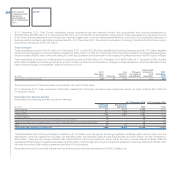
Receivables for dealer financing are typically generated by sales of vehicles and are generally managed under dealer network financing programs as a
component of the portfolio of the financial services companies. These receivables are interest bearing, with the exception of an initial limited, non-interest
bearing period. The contractual terms governing the relationships with the dealer networks vary from sector to sector and from country to country, although
payment terms range from two to six months.
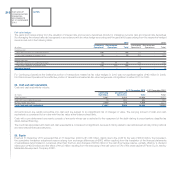
The fair value of receivables from financing activities classified as Continuing Operations at 31 December 2010 amounts to approximately €2,869 million, and
the fair value of receivables from financing activities classified as Discontinued Operations at 31 December 2010 amounts to approximately €11,090 million.
At 31 December 2009 the overall fair value of Receivables from financing activities was €12,876 million. These fair values have been calculated using a
discounted cash flow method based on the following discount rates, adjusted where necessary to take account of the specific insolvency risk of the underlying
financial instrument.
(in %) EUR USD GBP CAD AUD BRL PLN
Interest rate for six months 1.23 0.46 1.05 1.46 5.18 11.62 4.16
Interest rate for one year 1.51 0.78 1.51 1.78 5.20 12.04 4.43
Interest rate for five years 2.56 2.22 2.67 2.61 5.89 12.21 5.47