Chrysler 2010 Annual Report Download - page 211
Download and view the complete annual report
Please find page 211 of the 2010 Chrysler annual report below. You can navigate through the pages in the report by either clicking on the pages listed below, or by using the keyword search tool below to find specific information within the annual report.-
 1
1 -
2
-
3
-
4
-
5
-
6
-
7
-
8
-
9
-
10
-
11
-
12
-
13
-
14
-
15
-
16
-
17
-
18
-
19
-
20
-
21
-
22
-
23
-
24
-
25
-
26
-
27
-
28
-
29
-
30
-
31
-
32
-
33
-
34
-
35
-
36
-
37
-
38
-
39
-
40
-
41
-
42
-
43
-
44
-
45
-
46
-
47
-
48
-
49
-
50
-
51
-
52
-
53
-
54
-
55
-
56
-
57
-
58
-
59
-
60
-
61
-
62
-
63
-
64
-
65
-
66
-
67
-
68
-
69
-
70
-
71
-
72
-
73
-
74
-
75
-
76
-
77
-
78
-
79
-
80
-
81
-
82
-
83
-
84
-
85
-
86
-
87
-
88
-
89
-
90
-
91
-
92
-
93
-
94
-
95
-
96
-
97
-
98
-
99
-
100
-
101
-
102
-
103
-
104
-
105
-
106
-
107
-
108
-
109
-
110
-
111
-
112
-
113
-
114
-
115
-
116
-
117
-
118
-
119
-
120
-
121
-
122
-
123
-
124
-
125
-
126
-
127
-
128
-
129
-
130
-
131
-
132
-
133
-
134
-
135
-
136
-
137
-
138
-
139
-
140
-
141
-
142
-
143
-
144
-
145
-
146
-
147
-
148
-
149
-
150
-
151
-
152
-
153
-
154
-
155
-
156
-
157
-
158
-
159
-
160
-
161
-
162
-
163
-
164
-
165
-
166
-
167
-
168
-
169
-
170
-
171
-
172
-
173
-
174
-
175
-
176
-
177
-
178
-
179
-
180
-
181
-
182
-
183
-
184
-
185
-
186
-
187
-
188
-
189
-
190
-
191
-
192
-
193
-
194
-
195
-
196
-
197
-
198
-
199
-
200
-
 201
201 -
 202
202 -
 203
203 -
 204
204 -
 205
205 -
 206
206 -
 207
207 -
 208
208 -
 209
209 -
 210
210 -
 211
211 -
 212
212 -
 213
213 -
 214
214 -
 215
215 -
 216
216 -
 217
217 -
 218
218 -
 219
219 -
 220
220 -
 221
221 -
222
-
223
-
224
-
225
-
226
-
227
-
228
-
229
-
230
-
231
-
232
-
233
-
234
-
235
-
236
-
237
-
238
-
239
-
240
-
241
-
242
-
243
-
244
-
245
-
246
-
247
-
248
-
249
-
250
-
251
-
252
-
253
-
254
-
255
-
256
-
257
-
258
-
259
-
260
-
261
-
262
-
263
-
264
-
265
-
266
-
267
-
268
-
269
-
270
-
271
-
272
-
273
-
274
-
275
-
276
-
277
-
278
-
279
-
280
-
281
-
282
-
283
-
284
-
285
-
286
-
287
-
288
-
289
-
290
-
291
-
292
-
293
-
294
-
295
-
296
-
297
-
298
-
299
-
300
-
301
-
302
-
303
-
304
-
305
-
306
-
307
-
308
-
309
-
310
-
311
-
312
-
313
-
314
-
315
-
316
-
317
-
318
-
319
-
320
-
321
-
322
-
323
-
324
-
325
-
326
-
327
-
328
-
329
-
330
-
331
-
332
-
333
-
334
-
335
-
336
-
337
-
338
-
339
-
340
-
341
-
342
-
343
-
344
-
345
-
346
-
347
-
348
-
349
-
350
-
351
-
352
-
353
-
354
-
355
-
356
-
357
-
358
-
359
-
360
-
361
-
362
-
363
-
364
-
365
-
366
-
367
-
368
-
369
-
370
-
371
-
372
-
373
-
374
-
375
-
376
-
377
-
378
-
379
-
380
-
381
-
382
-
383
-
384
-
385
-
386
-
387
-
388
-
389
-
390
-
391
-
392
-
393
-
394
-
395
-
396
-
397
-
398
-
399
-
400
-
401
-
402
 |
 |

FIAT GROUP
CONSOLIDATED
FINANCIAL
STATEMENTS
AT 31 DECEMBER
2010
NOTES
210
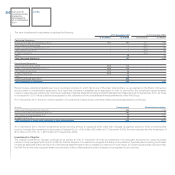
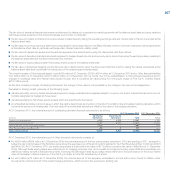
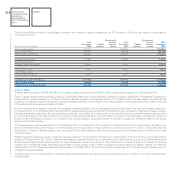
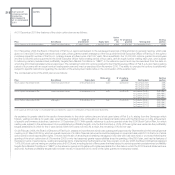
Fair value hedges
The gains and losses arising from the valuation of interest rate and currency derivatives (mostly for managing currency risk) and interest rate derivatives
(for managing the interest rate risk) recognised in accordance with fair value hedge accounting and the gains and losses arising from the respective hedged
items are set out in the following table:
2010 2009
Continuing Discontinued Continuing Discontinued
(€ million) Operations Operations Total Operations Operations Total
Currency risk
Net gains (losses) on qualifying hedges (50) - (50) 22 - 22
Fair value changes in hedged items 50 - 50 (22) - (22)
Interest rate risk
Net gains (losses) on qualifying hedges 15 11 26 (15) - (15)
Fair value changes in hedged items (15) (11) (26) 17 - 17
Net gains (losses) - - - 2 - 2
For Continuing Operations the ineffective portion of transactions treated as fair value hedges in 2010 was not significant (gains of €2 million in 2009).
For Discontinued Operations the ineffective portion of transactions treated as fair value hedges was not significant in either 2010 or 2009.
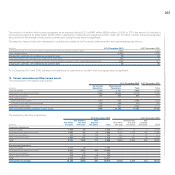
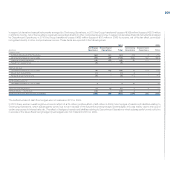
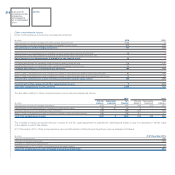
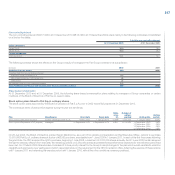
22. Cash and cash equivalents
Cash and cash equivalents include:
At 31 December 2010 At 31 December 2009
Continuing Discontinued
(€ million) Operations Operations Total Total
Cash at banks 8,407 2,523 10,930 9,422
Cash with a pre-determined use 10 684 694 530
Money market securities 3,550 479 4,029 2,274
Total Cash and cash equivalents 11,967 3,686 15,653 12,226
Amounts shown are readily convertible into cash and are subject to an insignificant risk of changes in value. The carrying amount of cash and cash
equivalents is considered to be in line with their fair value at the balance sheet date.
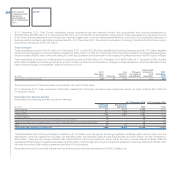
Cash with a pre-determined use mainly consists of amounts whose use is restricted to the repayment of the debt relating to securitisations classified as
Asset-backed financing.
The credit risk associated with Cash and cash equivalents is considered not significant, because it mainly relates to deposits spread across primary national
and international financial institutions.
23. Equity
Equity at 31 December 2010 exceeded that at 31 December 2009 by €1,346 million, mainly due to the profit for the year of €600 million, the increase in
the cumulative translation adjustment reserve arising from exchange differences of €862 million resulting from the translation of the financial statements
of subsidiaries denominated in currencies other than the Euro and changes of €182 million in the cash flow hedge reserve, partially offset by a dividend
distribution of €239 million and the effect of €122 million resulting from the exercising of the call option on 5% of the share capital of Ferrari S.p.A. held by
Mubadala Development Company PJSC.