Chrysler 2010 Annual Report Download - page 325
Download and view the complete annual report
Please find page 325 of the 2010 Chrysler annual report below. You can navigate through the pages in the report by either clicking on the pages listed below, or by using the keyword search tool below to find specific information within the annual report.-
 1
1 -
2
-
3
-
4
-
5
-
6
-
7
-
8
-
9
-
10
-
11
-
12
-
13
-
14
-
15
-
16
-
17
-
18
-
19
-
20
-
21
-
22
-
23
-
24
-
25
-
26
-
27
-
28
-
29
-
30
-
31
-
32
-
33
-
34
-
35
-
36
-
37
-
38
-
39
-
40
-
41
-
42
-
43
-
44
-
45
-
46
-
47
-
48
-
49
-
50
-
51
-
52
-
53
-
54
-
55
-
56
-
57
-
58
-
59
-
60
-
61
-
62
-
63
-
64
-
65
-
66
-
67
-
68
-
69
-
70
-
71
-
72
-
73
-
74
-
75
-
76
-
77
-
78
-
79
-
80
-
81
-
82
-
83
-
84
-
85
-
86
-
87
-
88
-
89
-
90
-
91
-
92
-
93
-
94
-
95
-
96
-
97
-
98
-
99
-
100
-
101
-
102
-
103
-
104
-
105
-
106
-
107
-
108
-
109
-
110
-
111
-
112
-
113
-
114
-
115
-
116
-
117
-
118
-
119
-
120
-
121
-
122
-
123
-
124
-
125
-
126
-
127
-
128
-
129
-
130
-
131
-
132
-
133
-
134
-
135
-
136
-
137
-
138
-
139
-
140
-
141
-
142
-
143
-
144
-
145
-
146
-
147
-
148
-
149
-
150
-
151
-
152
-
153
-
154
-
155
-
156
-
157
-
158
-
159
-
160
-
161
-
162
-
163
-
164
-
165
-
166
-
167
-
168
-
169
-
170
-
171
-
172
-
173
-
174
-
175
-
176
-
177
-
178
-
179
-
180
-
181
-
182
-
183
-
184
-
185
-
186
-
187
-
188
-
189
-
190
-
191
-
192
-
193
-
194
-
195
-
196
-
197
-
198
-
199
-
200
-
201
-
202
-
203
-
204
-
205
-
206
-
207
-
208
-
209
-
210
-
211
-
212
-
213
-
214
-
215
-
216
-
217
-
218
-
219
-
220
-
221
-
222
-
223
-
224
-
225
-
226
-
227
-
228
-
229
-
230
-
231
-
232
-
233
-
234
-
235
-
236
-
237
-
238
-
239
-
240
-
241
-
242
-
243
-
244
-
245
-
246
-
247
-
248
-
249
-
250
-
251
-
252
-
253
-
254
-
255
-
256
-
257
-
258
-
259
-
260
-
261
-
262
-
263
-
264
-
265
-
266
-
267
-
268
-
269
-
270
-
271
-
272
-
273
-
274
-
275
-
276
-
277
-
278
-
279
-
280
-
281
-
282
-
283
-
284
-
285
-
286
-
287
-
288
-
289
-
290
-
291
-
292
-
293
-
294
-
295
-
296
-
297
-
298
-
299
-
300
-
301
-
302
-
303
-
304
-
305
-
306
-
307
-
308
-
309
-
310
-
311
-
312
-
313
-
314
-
 315
315 -
 316
316 -
 317
317 -
 318
318 -
 319
319 -
 320
320 -
 321
321 -
 322
322 -
 323
323 -
 324
324 -
 325
325 -
 326
326 -
 327
327 -
 328
328 -
 329
329 -
 330
330 -
 331
331 -
 332
332 -
 333
333 -
 334
334 -
 335
335 -
336
-
337
-
338
-
339
-
340
-
341
-
342
-
343
-
344
-
345
-
346
-
347
-
348
-
349
-
350
-
351
-
352
-
353
-
354
-
355
-
356
-
357
-
358
-
359
-
360
-
361
-
362
-
363
-
364
-
365
-
366
-
367
-
368
-
369
-
370
-
371
-
372
-
373
-
374
-
375
-
376
-
377
-
378
-
379
-
380
-
381
-
382
-
383
-
384
-
385
-
386
-
387
-
388
-
389
-
390
-
391
-
392
-
393
-
394
-
395
-
396
-
397
-
398
-
399
-
400
-
401
-
402
 |
 |

FIAT S.P.A.
STATUTORY
FINANCIAL
STATEMENTS AT
31 DECEMBER
2010
NOTES
324
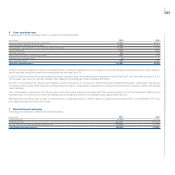
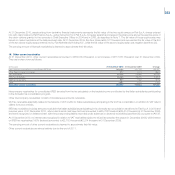
Financial income consisted of the following:
(€ thousand) 2010 2009
Financial income from Group companies:
Interest income on current account with Fiat Finance S.p.A. 22,938 3,427
Fee income for sureties and personal guarantees 5,255 5,440
Other financial income 52 63
Total financial income from Group companies 28,245 8,930
Financial income from third parties:
Interest income on bank and other deposits 6 9
Interest income on tax credits 2,963 5,134
Total financial income from third parties 2,969 5,143
Currency translation gains/(losses) (4) 117
Total financial income 31,210 14,190
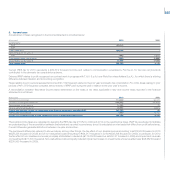
Financial expense consisted of the following:
(€ thousand)
2010 2009
Financial expense to Group companies:
Interest expense on current account with Fiat Finance S.p.A. - 598
Interest expense on Fiat Finance S.p.A. loans 224,955 124,590
Commissions and other charges payable to Fiat Netherlands Holding N.V. 5,808 6,255
Commissions and other charges payable to Fiat Finance S.p.A. 79 7
Commissions and other charges payable to Fidis S.p.A. 1,642 91
Interest and financial expense to other Group companies 119 266
Total financial expense to Group companies 232,603 131,807
Financial expense to third parties:
Interest expense and charges for the sale of receivables 847 8,778
Financial expense on employee benefits 517 1,084
Other third party interest and financial expense 863 3,204
Total financial expense to third parties 2,227 13,066
Total financial expense 234,830 144,873
Net income from derivative financial instruments of €110,585 thousand (net income of €116,992 thousand for 2009) was essentially attributable to the gain
arising from the change in fair value of the two equity swaps (which expire in 2011, following extension of the two contracts during the year) entered into as
hedges against Fiat shares rising above the exercise price of the stock options granted to the Chief Executive Officer in 2004 and 2006 (see Note 19). At 31
December 2010, the equity swaps had a notional value, based on the contractual strike price, of €203,941 thousand. Although these equity swaps were
entered into for hedging purposes, they do not qualify for hedge accounting under IFRS and accordingly are classified as held for trading. Following the
Demerger, those equity swaps will based on the stock market performance of a basket consisting of the shares in Fiat S.p.A. and in Fiat Industrial S.p.A.