Chrysler 2010 Annual Report Download - page 251
Download and view the complete annual report
Please find page 251 of the 2010 Chrysler annual report below. You can navigate through the pages in the report by either clicking on the pages listed below, or by using the keyword search tool below to find specific information within the annual report.-
 1
1 -
2
-
3
-
4
-
5
-
6
-
7
-
8
-
9
-
10
-
11
-
12
-
13
-
14
-
15
-
16
-
17
-
18
-
19
-
20
-
21
-
22
-
23
-
24
-
25
-
26
-
27
-
28
-
29
-
30
-
31
-
32
-
33
-
34
-
35
-
36
-
37
-
38
-
39
-
40
-
41
-
42
-
43
-
44
-
45
-
46
-
47
-
48
-
49
-
50
-
51
-
52
-
53
-
54
-
55
-
56
-
57
-
58
-
59
-
60
-
61
-
62
-
63
-
64
-
65
-
66
-
67
-
68
-
69
-
70
-
71
-
72
-
73
-
74
-
75
-
76
-
77
-
78
-
79
-
80
-
81
-
82
-
83
-
84
-
85
-
86
-
87
-
88
-
89
-
90
-
91
-
92
-
93
-
94
-
95
-
96
-
97
-
98
-
99
-
100
-
101
-
102
-
103
-
104
-
105
-
106
-
107
-
108
-
109
-
110
-
111
-
112
-
113
-
114
-
115
-
116
-
117
-
118
-
119
-
120
-
121
-
122
-
123
-
124
-
125
-
126
-
127
-
128
-
129
-
130
-
131
-
132
-
133
-
134
-
135
-
136
-
137
-
138
-
139
-
140
-
141
-
142
-
143
-
144
-
145
-
146
-
147
-
148
-
149
-
150
-
151
-
152
-
153
-
154
-
155
-
156
-
157
-
158
-
159
-
160
-
161
-
162
-
163
-
164
-
165
-
166
-
167
-
168
-
169
-
170
-
171
-
172
-
173
-
174
-
175
-
176
-
177
-
178
-
179
-
180
-
181
-
182
-
183
-
184
-
185
-
186
-
187
-
188
-
189
-
190
-
191
-
192
-
193
-
194
-
195
-
196
-
197
-
198
-
199
-
200
-
201
-
202
-
203
-
204
-
205
-
206
-
207
-
208
-
209
-
210
-
211
-
212
-
213
-
214
-
215
-
216
-
217
-
218
-
219
-
220
-
221
-
222
-
223
-
224
-
225
-
226
-
227
-
228
-
229
-
230
-
231
-
232
-
233
-
234
-
235
-
236
-
237
-
238
-
239
-
240
-
 241
241 -
 242
242 -
 243
243 -
 244
244 -
 245
245 -
 246
246 -
 247
247 -
 248
248 -
 249
249 -
 250
250 -
 251
251 -
 252
252 -
 253
253 -
 254
254 -
 255
255 -
 256
256 -
 257
257 -
 258
258 -
 259
259 -
 260
260 -
 261
261 -
262
-
263
-
264
-
265
-
266
-
267
-
268
-
269
-
270
-
271
-
272
-
273
-
274
-
275
-
276
-
277
-
278
-
279
-
280
-
281
-
282
-
283
-
284
-
285
-
286
-
287
-
288
-
289
-
290
-
291
-
292
-
293
-
294
-
295
-
296
-
297
-
298
-
299
-
300
-
301
-
302
-
303
-
304
-
305
-
306
-
307
-
308
-
309
-
310
-
311
-
312
-
313
-
314
-
315
-
316
-
317
-
318
-
319
-
320
-
321
-
322
-
323
-
324
-
325
-
326
-
327
-
328
-
329
-
330
-
331
-
332
-
333
-
334
-
335
-
336
-
337
-
338
-
339
-
340
-
341
-
342
-
343
-
344
-
345
-
346
-
347
-
348
-
349
-
350
-
351
-
352
-
353
-
354
-
355
-
356
-
357
-
358
-
359
-
360
-
361
-
362
-
363
-
364
-
365
-
366
-
367
-
368
-
369
-
370
-
371
-
372
-
373
-
374
-
375
-
376
-
377
-
378
-
379
-
380
-
381
-
382
-
383
-
384
-
385
-
386
-
387
-
388
-
389
-
390
-
391
-
392
-
393
-
394
-
395
-
396
-
397
-
398
-
399
-
400
-
401
-
402
 |
 |

FIAT GROUP
CONSOLIDATED
FINANCIAL
STATEMENTS
AT 31 DECEMBER
2010
NOTES
250
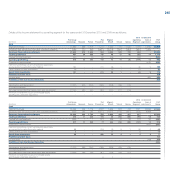
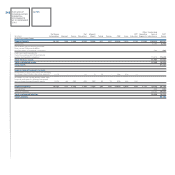
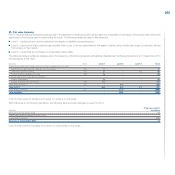
The following is an analysis of revenues earned from external customers in the Rest of the World:
2010 2009
Disconti- Disconti-
Continuing nued Continuing nued
(€ million) Operations Operations Eliminations Total Operations Operations Eliminations Total
Brazil 9,246 3,104 (454) 11,896 7,285 1,736 (196) 8,825
United States 1,057 4,359 (3) 5,413 762 3,816 (5) 4,573
France 2,244 1,806 (32) 4,018 2,119 1,936 (25) 4,030
Germany 2,739 1,190 (32) 3,897 2,977 1,173 (12) 4,138
UK 1,261 602 (6) 1,857 1,236 575 (4) 1,807
Spain 1,021 697 (12) 1,706 711 643 (12) 1,342
Turkey 1,247 199 - 1,446 902 97 - 999
Poland 1,057 307 (1) 1,363 1,284 284 (1) 1,567
China 602 415 (4) 1,013 411 307 (4) 714
Other 5,624 6,172 (54) 11,742 4,250 5,151 (38) 9,363
Total revenues from external customers in RoW 26,098 18,851 (598) 44,351 21,937 15,718 (297) 37,358
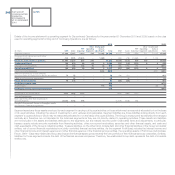
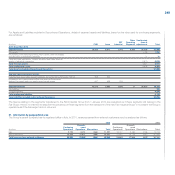
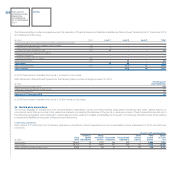
Total non-current Assets, excluding financial assets, deferred tax assets, defined benefit assets and rights arising under insurance contracts located in Italy and
classified as Continuing and Discontinued Operations totalled €11,272 million at 31 December 2010; the corresponding item classified as Discontinued Operations at
31 December 2010 amounts to €1,782 million. At 31 December 2009, the total amount of non-current Assets (as defined above) located in Italy was
€11,419 million. The total of such assets located in the Rest of the World and classified as Continuing Operations totalled €6,005 million at 31 December
2010; the corresponding item classified as Discontinued Operations at 31 December 2010 amounts to €6,824 million. At 31 December 2009, for the Fiat
Group overall, the total amount of non-current Assets situated in the Rest of the World was €11,163 million. Non-current assets located in the Rest of the
World may be analysed as follows:
At 31 December 2010 At 31 December 2009
Continuing Discontinued
(€ million) Operations Operations Total Total
United States 257 3,035 3,292 2,986
Brazil 2,412 436 2,848 2,307
Poland 1,612 45 1,657 1,288
France 331 619 950 918
Germany 157 493 650 669
Spain 90 482 572 581
China 180 304 484 383
Other 966 1,410 2,376 2,031
Total non current assets in RoW 6,005 6,824 12,829 11,163
In 2010 and 2009, no single external customer of the Group accounted for 10 percent or more of consolidated revenues.
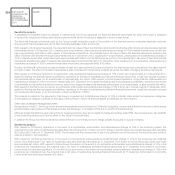
32. Information on financial risks
The Group is exposed to the following financial risks connected with its operations:
credit risk, regarding its normal business relations with customers and dealers, and its financing activities;
liquidity risk, with particular reference to the availability of funds and access to the credit market and to financial instruments in general;
market risk (principally relating to exchange rates, interest rates), since the Group operates at an international level in different currencies and uses financial
instruments which generate interest. The Group is also exposed to the risk of changes in the price of certain listed shares.