Chrysler 2010 Annual Report Download - page 199
Download and view the complete annual report
Please find page 199 of the 2010 Chrysler annual report below. You can navigate through the pages in the report by either clicking on the pages listed below, or by using the keyword search tool below to find specific information within the annual report.-
 1
1 -
2
-
3
-
4
-
5
-
6
-
7
-
8
-
9
-
10
-
11
-
12
-
13
-
14
-
15
-
16
-
17
-
18
-
19
-
20
-
21
-
22
-
23
-
24
-
25
-
26
-
27
-
28
-
29
-
30
-
31
-
32
-
33
-
34
-
35
-
36
-
37
-
38
-
39
-
40
-
41
-
42
-
43
-
44
-
45
-
46
-
47
-
48
-
49
-
50
-
51
-
52
-
53
-
54
-
55
-
56
-
57
-
58
-
59
-
60
-
61
-
62
-
63
-
64
-
65
-
66
-
67
-
68
-
69
-
70
-
71
-
72
-
73
-
74
-
75
-
76
-
77
-
78
-
79
-
80
-
81
-
82
-
83
-
84
-
85
-
86
-
87
-
88
-
89
-
90
-
91
-
92
-
93
-
94
-
95
-
96
-
97
-
98
-
99
-
100
-
101
-
102
-
103
-
104
-
105
-
106
-
107
-
108
-
109
-
110
-
111
-
112
-
113
-
114
-
115
-
116
-
117
-
118
-
119
-
120
-
121
-
122
-
123
-
124
-
125
-
126
-
127
-
128
-
129
-
130
-
131
-
132
-
133
-
134
-
135
-
136
-
137
-
138
-
139
-
140
-
141
-
142
-
143
-
144
-
145
-
146
-
147
-
148
-
149
-
150
-
151
-
152
-
153
-
154
-
155
-
156
-
157
-
158
-
159
-
160
-
161
-
162
-
163
-
164
-
165
-
166
-
167
-
168
-
169
-
170
-
171
-
172
-
173
-
174
-
175
-
176
-
177
-
178
-
179
-
180
-
181
-
182
-
183
-
184
-
185
-
186
-
187
-
188
-
 189
189 -
 190
190 -
 191
191 -
 192
192 -
 193
193 -
 194
194 -
 195
195 -
 196
196 -
 197
197 -
 198
198 -
 199
199 -
 200
200 -
 201
201 -
 202
202 -
 203
203 -
 204
204 -
 205
205 -
 206
206 -
 207
207 -
 208
208 -
 209
209 -
210
-
211
-
212
-
213
-
214
-
215
-
216
-
217
-
218
-
219
-
220
-
221
-
222
-
223
-
224
-
225
-
226
-
227
-
228
-
229
-
230
-
231
-
232
-
233
-
234
-
235
-
236
-
237
-
238
-
239
-
240
-
241
-
242
-
243
-
244
-
245
-
246
-
247
-
248
-
249
-
250
-
251
-
252
-
253
-
254
-
255
-
256
-
257
-
258
-
259
-
260
-
261
-
262
-
263
-
264
-
265
-
266
-
267
-
268
-
269
-
270
-
271
-
272
-
273
-
274
-
275
-
276
-
277
-
278
-
279
-
280
-
281
-
282
-
283
-
284
-
285
-
286
-
287
-
288
-
289
-
290
-
291
-
292
-
293
-
294
-
295
-
296
-
297
-
298
-
299
-
300
-
301
-
302
-
303
-
304
-
305
-
306
-
307
-
308
-
309
-
310
-
311
-
312
-
313
-
314
-
315
-
316
-
317
-
318
-
319
-
320
-
321
-
322
-
323
-
324
-
325
-
326
-
327
-
328
-
329
-
330
-
331
-
332
-
333
-
334
-
335
-
336
-
337
-
338
-
339
-
340
-
341
-
342
-
343
-
344
-
345
-
346
-
347
-
348
-
349
-
350
-
351
-
352
-
353
-
354
-
355
-
356
-
357
-
358
-
359
-
360
-
361
-
362
-
363
-
364
-
365
-
366
-
367
-
368
-
369
-
370
-
371
-
372
-
373
-
374
-
375
-
376
-
377
-
378
-
379
-
380
-
381
-
382
-
383
-
384
-
385
-
386
-
387
-
388
-
389
-
390
-
391
-
392
-
393
-
394
-
395
-
396
-
397
-
398
-
399
-
400
-
401
-
402
 |
 |

FIAT GROUP
CONSOLIDATED
FINANCIAL
STATEMENTS
AT 31 DECEMBER
2010
NOTES
198
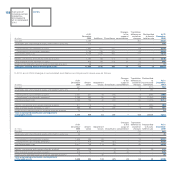
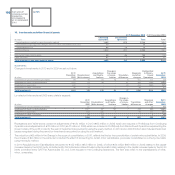
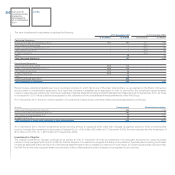
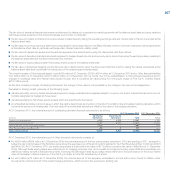
16. Investments and other financial assets
At 31 December 2010 At 31 December 2009
Continuing Discontinued
(€ million) Operations Operations Total Total
Investments accounted for using the equity method 1,465 679 2,144 1,884
Investments at fair value with changes directly in other comprehensive income 17 - 17 21
Investments at cost 62 12 74 76
Total Investments 1,544 691 2,235 1,981
Non-current financial receivables 62 46 108 138
Other securities 47 - 47 40
Total Investments and other financial assets 1,653 737 2,390 2,159
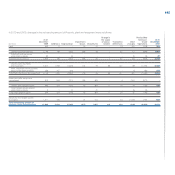
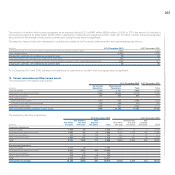
Investments
Changes in Investments in 2010 and in 2009 are set out below:
Change in Reclassified
At 31 Acquisitions the scope Disposals to Discon- At 31
December Revaluations/ and Capita- of conso- Translation and other tinued December
(€ million) 2009 (Write-downs) lisations lidation differences changes Operations 2010
Investments in unconsolidated subsidiaries 69 (6) 34 (5) 3 (11) (11) 73
Investments in jointly controlled entities 1,431 176 98 - 51 (95) (338) 1,323
Investments in associates 441 11 - - 23 (12) (342) 121
Investments in other companies 40 (5) - - - (8) - 27
Total Investments 1,981 176 132 (5) 77 (126) (691) 1,544
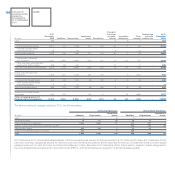
Le variazioni intervenute nel 2009 erano state le seguenti:
Change in
At 31 Acquisitions the scope Disposals At 31
December Revaluations/ and Capita- of conso- Translation and other December
(€ million) 2008 (Write-downs) lisations lidation differences changes 2009
Investments in unconsolidated subsidiaries 57 1 11 2 - (2) 69
Investments in jointly controlled entities 1,377 67 51 - (12) (52) 1,431
Investments in associates 512 (46) 1 - (9) (17) 441
Investments in other companies 38 (1) - - - 3 40
Total Investments 1,984 21 63 2 (21) (68) 1,981
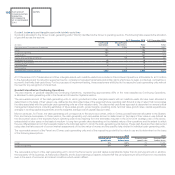
Revaluations and Write-downs consist of adjustments of €120 million in 2010 (€65 million in 2009) which are included in Profit/(loss) from Continuing
Operations and adjustments of €70 million in 2010 (€-47 million in 2009) which are included in Profit/(loss) from Discontinued Operations representing the
Group’s share of the profit or loss for the year of investments accounted for using the equity method. In 2010 and in 2009 this item also includes impairment
losses recognised during the period for investments accounted for using the cost method.
The reduction of €5 million in the Change in the scope of consolidation, in 2010, reflects the line-by-line consolidation of certain minor subsidiaries. In 2009,
the increase of €2 million in the same item included the effect of accounting for certain minor subsidiaries, previously consolidated on a line-by-line basis,
using the equity method.
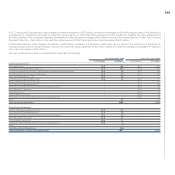
In 2010 Acquisitions and Capitalisations amounted to €132 million (€63 million in 2009), of which €34 million (€48 million in 2009) relates to the capital
increase made by the 50/50 jointly controlled entity Fiat India Automobiles Private Limited and €50 million relating to the capital increase made by the 50/50
jointly controlled entity GAC Fiat Automobiles Co. Ltd., both included in the Continuing Operations. The item also refers to the capitalisations of other,
minor, companies.