Chrysler 2010 Annual Report Download - page 82
Download and view the complete annual report
Please find page 82 of the 2010 Chrysler annual report below. You can navigate through the pages in the report by either clicking on the pages listed below, or by using the keyword search tool below to find specific information within the annual report.-
 1
1 -
2
-
3
-
4
-
5
-
6
-
7
-
8
-
9
-
10
-
11
-
12
-
13
-
14
-
15
-
16
-
17
-
18
-
19
-
20
-
21
-
22
-
23
-
24
-
25
-
26
-
27
-
28
-
29
-
30
-
31
-
32
-
33
-
34
-
35
-
36
-
37
-
38
-
39
-
40
-
41
-
42
-
43
-
44
-
45
-
46
-
47
-
48
-
49
-
50
-
51
-
52
-
53
-
54
-
55
-
56
-
57
-
58
-
59
-
60
-
61
-
62
-
63
-
64
-
65
-
66
-
67
-
68
-
69
-
70
-
71
-
 72
72 -
 73
73 -
 74
74 -
 75
75 -
 76
76 -
 77
77 -
 78
78 -
 79
79 -
 80
80 -
 81
81 -
 82
82 -
 83
83 -
 84
84 -
 85
85 -
 86
86 -
 87
87 -
 88
88 -
 89
89 -
 90
90 -
 91
91 -
 92
92 -
93
-
94
-
95
-
96
-
97
-
98
-
99
-
100
-
101
-
102
-
103
-
104
-
105
-
106
-
107
-
108
-
109
-
110
-
111
-
112
-
113
-
114
-
115
-
116
-
117
-
118
-
119
-
120
-
121
-
122
-
123
-
124
-
125
-
126
-
127
-
128
-
129
-
130
-
131
-
132
-
133
-
134
-
135
-
136
-
137
-
138
-
139
-
140
-
141
-
142
-
143
-
144
-
145
-
146
-
147
-
148
-
149
-
150
-
151
-
152
-
153
-
154
-
155
-
156
-
157
-
158
-
159
-
160
-
161
-
162
-
163
-
164
-
165
-
166
-
167
-
168
-
169
-
170
-
171
-
172
-
173
-
174
-
175
-
176
-
177
-
178
-
179
-
180
-
181
-
182
-
183
-
184
-
185
-
186
-
187
-
188
-
189
-
190
-
191
-
192
-
193
-
194
-
195
-
196
-
197
-
198
-
199
-
200
-
201
-
202
-
203
-
204
-
205
-
206
-
207
-
208
-
209
-
210
-
211
-
212
-
213
-
214
-
215
-
216
-
217
-
218
-
219
-
220
-
221
-
222
-
223
-
224
-
225
-
226
-
227
-
228
-
229
-
230
-
231
-
232
-
233
-
234
-
235
-
236
-
237
-
238
-
239
-
240
-
241
-
242
-
243
-
244
-
245
-
246
-
247
-
248
-
249
-
250
-
251
-
252
-
253
-
254
-
255
-
256
-
257
-
258
-
259
-
260
-
261
-
262
-
263
-
264
-
265
-
266
-
267
-
268
-
269
-
270
-
271
-
272
-
273
-
274
-
275
-
276
-
277
-
278
-
279
-
280
-
281
-
282
-
283
-
284
-
285
-
286
-
287
-
288
-
289
-
290
-
291
-
292
-
293
-
294
-
295
-
296
-
297
-
298
-
299
-
300
-
301
-
302
-
303
-
304
-
305
-
306
-
307
-
308
-
309
-
310
-
311
-
312
-
313
-
314
-
315
-
316
-
317
-
318
-
319
-
320
-
321
-
322
-
323
-
324
-
325
-
326
-
327
-
328
-
329
-
330
-
331
-
332
-
333
-
334
-
335
-
336
-
337
-
338
-
339
-
340
-
341
-
342
-
343
-
344
-
345
-
346
-
347
-
348
-
349
-
350
-
351
-
352
-
353
-
354
-
355
-
356
-
357
-
358
-
359
-
360
-
361
-
362
-
363
-
364
-
365
-
366
-
367
-
368
-
369
-
370
-
371
-
372
-
373
-
374
-
375
-
376
-
377
-
378
-
379
-
380
-
381
-
382
-
383
-
384
-
385
-
386
-
387
-
388
-
389
-
390
-
391
-
392
-
393
-
394
-
395
-
396
-
397
-
398
-
399
-
400
-
401
-
402
 |
 |

81
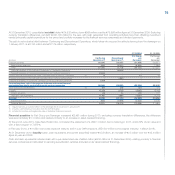
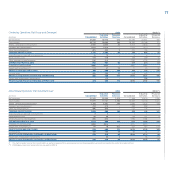
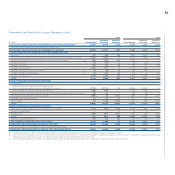
Assets and liabilities held for sale and Discontinued Operations by Activity
At 31 December 2010, this item consisted of the following:
Total Industrial Financial
(€ million)
Discontinued Operations Activities Services
Intangible assets 3,567 3,466 101
Property, plant and equipment 3,856 3,852 4
Investments and other financial assets 737 2,076 227
Leased assets 492 22 470
Defined benefit plan assets 166 161 5
Deferred tax assets 1,211 1,115 96
Total non-current assets 10,029 10,692 903
Inventory 3,898 3,801 97
Trade receivables 1,791 1,763 113
Receivables from financing activities 10,908 1,841 11,501
Financial receivables from Continuing Operations 2,865 2,541 324
Current taxes receivable 552 414 140
Other current assets 934 724 231
Current financial assets: 112 70 42
Current investments - - -
Current securities 24 - 24
Other financial assets 88 70 18
Cash and cash equivalents 3,686 2,500 1,186
Total current assets 24,746 13,654 13,634
Assets held for sale 11 9 2
TOTAL ASSETS HELD FOR SALE AND DISCONTINUED OPERATIONS 34,786 24,355 14,539
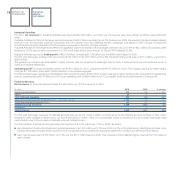
Provisions: 4,275 4,241 34
Employee benefits 2,017 2,001 16
Other provisions 2,258 2,240 18
Financial payables: 18,695 8,659 12,470
Asset-backed financing 8,321 105 8,216
Financial payables to Continuing Operations 5,626 4,291 1,335
Other 4,748 4,263 2,919
Other financial liabilities 147 126 21
Trade payables 3,906 3,890 102
Current taxes payable 503 371 132
Deferred tax liabilities 52 48 4
Other current liabilities 2,342 2,151 210
TOTAL LIABILITIES HELD FOR SALE AND DISCONTINUED OPERATIONS 29,920 19,486 12,973