Chrysler 2010 Annual Report Download - page 203
Download and view the complete annual report
Please find page 203 of the 2010 Chrysler annual report below. You can navigate through the pages in the report by either clicking on the pages listed below, or by using the keyword search tool below to find specific information within the annual report.-
 1
1 -
2
-
3
-
4
-
5
-
6
-
7
-
8
-
9
-
10
-
11
-
12
-
13
-
14
-
15
-
16
-
17
-
18
-
19
-
20
-
21
-
22
-
23
-
24
-
25
-
26
-
27
-
28
-
29
-
30
-
31
-
32
-
33
-
34
-
35
-
36
-
37
-
38
-
39
-
40
-
41
-
42
-
43
-
44
-
45
-
46
-
47
-
48
-
49
-
50
-
51
-
52
-
53
-
54
-
55
-
56
-
57
-
58
-
59
-
60
-
61
-
62
-
63
-
64
-
65
-
66
-
67
-
68
-
69
-
70
-
71
-
72
-
73
-
74
-
75
-
76
-
77
-
78
-
79
-
80
-
81
-
82
-
83
-
84
-
85
-
86
-
87
-
88
-
89
-
90
-
91
-
92
-
93
-
94
-
95
-
96
-
97
-
98
-
99
-
100
-
101
-
102
-
103
-
104
-
105
-
106
-
107
-
108
-
109
-
110
-
111
-
112
-
113
-
114
-
115
-
116
-
117
-
118
-
119
-
120
-
121
-
122
-
123
-
124
-
125
-
126
-
127
-
128
-
129
-
130
-
131
-
132
-
133
-
134
-
135
-
136
-
137
-
138
-
139
-
140
-
141
-
142
-
143
-
144
-
145
-
146
-
147
-
148
-
149
-
150
-
151
-
152
-
153
-
154
-
155
-
156
-
157
-
158
-
159
-
160
-
161
-
162
-
163
-
164
-
165
-
166
-
167
-
168
-
169
-
170
-
171
-
172
-
173
-
174
-
175
-
176
-
177
-
178
-
179
-
180
-
181
-
182
-
183
-
184
-
185
-
186
-
187
-
188
-
189
-
190
-
191
-
192
-
 193
193 -
 194
194 -
 195
195 -
 196
196 -
 197
197 -
 198
198 -
 199
199 -
 200
200 -
 201
201 -
 202
202 -
 203
203 -
 204
204 -
 205
205 -
 206
206 -
 207
207 -
 208
208 -
 209
209 -
 210
210 -
 211
211 -
 212
212 -
 213
213 -
214
-
215
-
216
-
217
-
218
-
219
-
220
-
221
-
222
-
223
-
224
-
225
-
226
-
227
-
228
-
229
-
230
-
231
-
232
-
233
-
234
-
235
-
236
-
237
-
238
-
239
-
240
-
241
-
242
-
243
-
244
-
245
-
246
-
247
-
248
-
249
-
250
-
251
-
252
-
253
-
254
-
255
-
256
-
257
-
258
-
259
-
260
-
261
-
262
-
263
-
264
-
265
-
266
-
267
-
268
-
269
-
270
-
271
-
272
-
273
-
274
-
275
-
276
-
277
-
278
-
279
-
280
-
281
-
282
-
283
-
284
-
285
-
286
-
287
-
288
-
289
-
290
-
291
-
292
-
293
-
294
-
295
-
296
-
297
-
298
-
299
-
300
-
301
-
302
-
303
-
304
-
305
-
306
-
307
-
308
-
309
-
310
-
311
-
312
-
313
-
314
-
315
-
316
-
317
-
318
-
319
-
320
-
321
-
322
-
323
-
324
-
325
-
326
-
327
-
328
-
329
-
330
-
331
-
332
-
333
-
334
-
335
-
336
-
337
-
338
-
339
-
340
-
341
-
342
-
343
-
344
-
345
-
346
-
347
-
348
-
349
-
350
-
351
-
352
-
353
-
354
-
355
-
356
-
357
-
358
-
359
-
360
-
361
-
362
-
363
-
364
-
365
-
366
-
367
-
368
-
369
-
370
-
371
-
372
-
373
-
374
-
375
-
376
-
377
-
378
-
379
-
380
-
381
-
382
-
383
-
384
-
385
-
386
-
387
-
388
-
389
-
390
-
391
-
392
-
393
-
394
-
395
-
396
-
397
-
398
-
399
-
400
-
401
-
402
 |
 |
FIAT GROUP
CONSOLIDATED
FINANCIAL
STATEMENTS
AT 31 DECEMBER
2010
NOTES
202
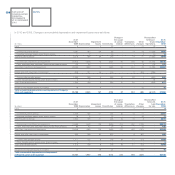
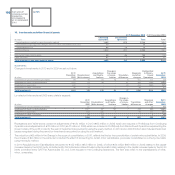
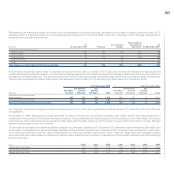
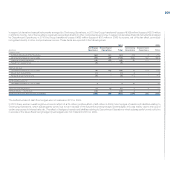
17. Leased assets
Leased assets refers to Discontinued Operations. The sectors Trucks and Commercial Vehicles and the Agricultural and Construction Equipment lease out
assets, mainly their own products, as part of their financial services businesses. This item changed as follows in 2010 and 2009:
Reclassified
At 31 Disposals to Discon- At 31
December Translation and other tinued December
(€ million) 2009 Additions Depreciation differences changes Operations 2010
Gross carrying amount 632 291 - 55 (304) (674) -
Less: Depreciation and impairment (175) - (95) (13) 101 182 -
Net carrying amount of Leased assets 457 291 (95) 42 (203) (492) -
At 31 Disposals At 31
December Translation and other December
(€ million) 2008 Additions Depreciation differences changes 2009
Gross carrying amount 674 219 - 3 (264) 632
Less: Depreciation and impairment (169) - (91) - 85 (175)
Net carrying amount of Leased assets 505 219 (91) 3 (179) 457
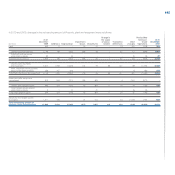
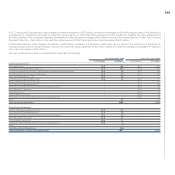
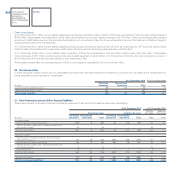
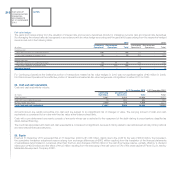
At 31 December 2010 minimum lease payments from non-cancellable operating leases of Discontinued Operations amount to €216 million (€178 million
at 31 December 2009) and fall due as follows:
(€ million) At 31 December 2010 At 31 December 2009
Within one year 98 83
Between one and five years 116 94
Beyond five years 2 1
Total Minimum lease payments 216 178
At 31 December 2010, Discontinued Operations include assets amounting to €4 million which are leased out under operating leases and act as security
for loans received.
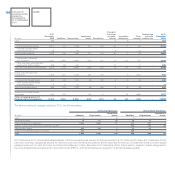
18. Inventories
At 31 December 2010 At 31 December 2009
Continuing Discontinued
(€ million) Operations Operations Total Total
Raw materials, supplies and finished goods 4,308 3,886 8,194 8,669
Gross amount due from customers for contract work 135 12 147 79
Total Inventories 4,443 3,898 8,341 8,748
There were no inventories pledged as security at 31 December 2010 and 2009, either in Continuing or Discontinued Operations.
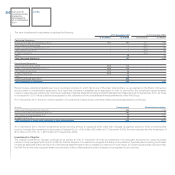
At 31 December 2010, total Inventories amount to €8,341 million. Assets sold with a buy-back commitment by Continuing Operations (Fiat Group
Automobiles sector) amount to €637 million at 31 December 2010 and assets which are no longer subject to operating lease arrangements or buy-back
commitments and are held for sale by Discontinued Operations (Trucks and Commercial Vehicles and Agricultural and Construction Equipment sectors)
amount to €159 million. Excluding these items totalling €796 million (€861 million at 31 December 2009), and excluding the reclassification to Discontinued
Operations, inventories decreased by €342 million in 2010.
At 31 December 2010, Inventories include those measured at net realisable value (estimated selling price less the estimated costs of completion and the
estimated costs necessary to make the sale) amounting to €2,698 million (€2,958 million at 31 December 2009). This amount is attributable to Continuing
Operations for €1,482 million and to Discontinued Operations for €1,216 million.