Chrysler 2010 Annual Report Download - page 250
Download and view the complete annual report
Please find page 250 of the 2010 Chrysler annual report below. You can navigate through the pages in the report by either clicking on the pages listed below, or by using the keyword search tool below to find specific information within the annual report.-
 1
1 -
2
-
3
-
4
-
5
-
6
-
7
-
8
-
9
-
10
-
11
-
12
-
13
-
14
-
15
-
16
-
17
-
18
-
19
-
20
-
21
-
22
-
23
-
24
-
25
-
26
-
27
-
28
-
29
-
30
-
31
-
32
-
33
-
34
-
35
-
36
-
37
-
38
-
39
-
40
-
41
-
42
-
43
-
44
-
45
-
46
-
47
-
48
-
49
-
50
-
51
-
52
-
53
-
54
-
55
-
56
-
57
-
58
-
59
-
60
-
61
-
62
-
63
-
64
-
65
-
66
-
67
-
68
-
69
-
70
-
71
-
72
-
73
-
74
-
75
-
76
-
77
-
78
-
79
-
80
-
81
-
82
-
83
-
84
-
85
-
86
-
87
-
88
-
89
-
90
-
91
-
92
-
93
-
94
-
95
-
96
-
97
-
98
-
99
-
100
-
101
-
102
-
103
-
104
-
105
-
106
-
107
-
108
-
109
-
110
-
111
-
112
-
113
-
114
-
115
-
116
-
117
-
118
-
119
-
120
-
121
-
122
-
123
-
124
-
125
-
126
-
127
-
128
-
129
-
130
-
131
-
132
-
133
-
134
-
135
-
136
-
137
-
138
-
139
-
140
-
141
-
142
-
143
-
144
-
145
-
146
-
147
-
148
-
149
-
150
-
151
-
152
-
153
-
154
-
155
-
156
-
157
-
158
-
159
-
160
-
161
-
162
-
163
-
164
-
165
-
166
-
167
-
168
-
169
-
170
-
171
-
172
-
173
-
174
-
175
-
176
-
177
-
178
-
179
-
180
-
181
-
182
-
183
-
184
-
185
-
186
-
187
-
188
-
189
-
190
-
191
-
192
-
193
-
194
-
195
-
196
-
197
-
198
-
199
-
200
-
201
-
202
-
203
-
204
-
205
-
206
-
207
-
208
-
209
-
210
-
211
-
212
-
213
-
214
-
215
-
216
-
217
-
218
-
219
-
220
-
221
-
222
-
223
-
224
-
225
-
226
-
227
-
228
-
229
-
230
-
231
-
232
-
233
-
234
-
235
-
236
-
237
-
238
-
239
-
 240
240 -
 241
241 -
 242
242 -
 243
243 -
 244
244 -
 245
245 -
 246
246 -
 247
247 -
 248
248 -
 249
249 -
 250
250 -
 251
251 -
 252
252 -
 253
253 -
 254
254 -
 255
255 -
 256
256 -
 257
257 -
 258
258 -
 259
259 -
 260
260 -
261
-
262
-
263
-
264
-
265
-
266
-
267
-
268
-
269
-
270
-
271
-
272
-
273
-
274
-
275
-
276
-
277
-
278
-
279
-
280
-
281
-
282
-
283
-
284
-
285
-
286
-
287
-
288
-
289
-
290
-
291
-
292
-
293
-
294
-
295
-
296
-
297
-
298
-
299
-
300
-
301
-
302
-
303
-
304
-
305
-
306
-
307
-
308
-
309
-
310
-
311
-
312
-
313
-
314
-
315
-
316
-
317
-
318
-
319
-
320
-
321
-
322
-
323
-
324
-
325
-
326
-
327
-
328
-
329
-
330
-
331
-
332
-
333
-
334
-
335
-
336
-
337
-
338
-
339
-
340
-
341
-
342
-
343
-
344
-
345
-
346
-
347
-
348
-
349
-
350
-
351
-
352
-
353
-
354
-
355
-
356
-
357
-
358
-
359
-
360
-
361
-
362
-
363
-
364
-
365
-
366
-
367
-
368
-
369
-
370
-
371
-
372
-
373
-
374
-
375
-
376
-
377
-
378
-
379
-
380
-
381
-
382
-
383
-
384
-
385
-
386
-
387
-
388
-
389
-
390
-
391
-
392
-
393
-
394
-
395
-
396
-
397
-
398
-
399
-
400
-
401
-
402
 |
 |

249
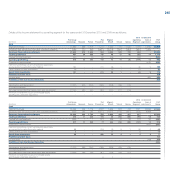
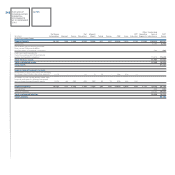
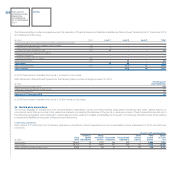
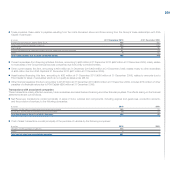
For Assets and Liabilities included in Discontinued Operations, details of segment assets and liabilities, based on the rules used for continuing segments,
are as follows:
Other Unallocated
FPT Operating items &
(€ million) CNH Iveco Industrial Segments adjustments Total
At 31 December 2010
Segment assets 19,268 6,977 1,744 5,855 (6,259) 27,585
Tax assets 1,763 1,763
Receivables from financing activities, Non-current Other receivables
and Securities of industrial companies 71 71
Cash and cash equivalents, Current securities and Other financial
assets of industrial companies 2,570 2,570
Total Treasury assets 2,641 2,641
Total unallocated assets 4,404 4,404
Total Assets included in Discontinued Operations 31,989
Segment operating assets include:
Investments in associates and joint-ventures accounted for by the equity method 358 320 -
Increases in non-current assets other than financial instruments,
deferred tax assets and post-employment benefit assets 447 635 126
Segment liabilities 15,376 5,902 1,198 11 (3,363) 19,124
Tax liabilities 700
Treasury liabilities 4,470
Total unallocated liabilities 5,170
Total Liabilities included in Discontinued Operations 24,294
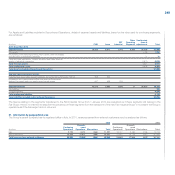
The figures relating to the segments transferred to the Fiat Industrial Group from 1 January 2010 are presented as if these segments still belong to the
Fiat Group; there is no intention to describe the operations of these segments from the standpoint of the new Fiat Industrial Group or to present the Group’s
operations as if the Demerger had not occurred.
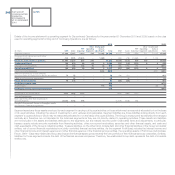
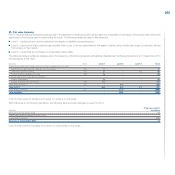
31. Information by geographical area
The Group’s parent company has its registered office in Italy. In 2010, revenues earned from external customers may be analysed as follows:
2010 2009
Disconti- Disconti-
Continuing nued Continuing nued
(€ million) Operations Operations Eliminations Total Operations Operations Eliminations Total
Italy 9,782 2,491 (366) 11,907 10,747 2,250 (253) 12,744
Rest of the world 26,098 18,851 (598) 44,351 21,937 15,718 (297) 37,358
Total revenues from external customers 35,880 21,342 (964) 56,258 32,684 17,968 (550) 50,102