Chrysler 2010 Annual Report Download - page 155
Download and view the complete annual report
Please find page 155 of the 2010 Chrysler annual report below. You can navigate through the pages in the report by either clicking on the pages listed below, or by using the keyword search tool below to find specific information within the annual report.-
 1
1 -
2
-
3
-
4
-
5
-
6
-
7
-
8
-
9
-
10
-
11
-
12
-
13
-
14
-
15
-
16
-
17
-
18
-
19
-
20
-
21
-
22
-
23
-
24
-
25
-
26
-
27
-
28
-
29
-
30
-
31
-
32
-
33
-
34
-
35
-
36
-
37
-
38
-
39
-
40
-
41
-
42
-
43
-
44
-
45
-
46
-
47
-
48
-
49
-
50
-
51
-
52
-
53
-
54
-
55
-
56
-
57
-
58
-
59
-
60
-
61
-
62
-
63
-
64
-
65
-
66
-
67
-
68
-
69
-
70
-
71
-
72
-
73
-
74
-
75
-
76
-
77
-
78
-
79
-
80
-
81
-
82
-
83
-
84
-
85
-
86
-
87
-
88
-
89
-
90
-
91
-
92
-
93
-
94
-
95
-
96
-
97
-
98
-
99
-
100
-
101
-
102
-
103
-
104
-
105
-
106
-
107
-
108
-
109
-
110
-
111
-
112
-
113
-
114
-
115
-
116
-
117
-
118
-
119
-
120
-
121
-
122
-
123
-
124
-
125
-
126
-
127
-
128
-
129
-
130
-
131
-
132
-
133
-
134
-
135
-
136
-
137
-
138
-
139
-
140
-
141
-
142
-
143
-
144
-
 145
145 -
 146
146 -
 147
147 -
 148
148 -
 149
149 -
 150
150 -
 151
151 -
 152
152 -
 153
153 -
 154
154 -
 155
155 -
 156
156 -
 157
157 -
 158
158 -
 159
159 -
 160
160 -
 161
161 -
 162
162 -
 163
163 -
 164
164 -
 165
165 -
166
-
167
-
168
-
169
-
170
-
171
-
172
-
173
-
174
-
175
-
176
-
177
-
178
-
179
-
180
-
181
-
182
-
183
-
184
-
185
-
186
-
187
-
188
-
189
-
190
-
191
-
192
-
193
-
194
-
195
-
196
-
197
-
198
-
199
-
200
-
201
-
202
-
203
-
204
-
205
-
206
-
207
-
208
-
209
-
210
-
211
-
212
-
213
-
214
-
215
-
216
-
217
-
218
-
219
-
220
-
221
-
222
-
223
-
224
-
225
-
226
-
227
-
228
-
229
-
230
-
231
-
232
-
233
-
234
-
235
-
236
-
237
-
238
-
239
-
240
-
241
-
242
-
243
-
244
-
245
-
246
-
247
-
248
-
249
-
250
-
251
-
252
-
253
-
254
-
255
-
256
-
257
-
258
-
259
-
260
-
261
-
262
-
263
-
264
-
265
-
266
-
267
-
268
-
269
-
270
-
271
-
272
-
273
-
274
-
275
-
276
-
277
-
278
-
279
-
280
-
281
-
282
-
283
-
284
-
285
-
286
-
287
-
288
-
289
-
290
-
291
-
292
-
293
-
294
-
295
-
296
-
297
-
298
-
299
-
300
-
301
-
302
-
303
-
304
-
305
-
306
-
307
-
308
-
309
-
310
-
311
-
312
-
313
-
314
-
315
-
316
-
317
-
318
-
319
-
320
-
321
-
322
-
323
-
324
-
325
-
326
-
327
-
328
-
329
-
330
-
331
-
332
-
333
-
334
-
335
-
336
-
337
-
338
-
339
-
340
-
341
-
342
-
343
-
344
-
345
-
346
-
347
-
348
-
349
-
350
-
351
-
352
-
353
-
354
-
355
-
356
-
357
-
358
-
359
-
360
-
361
-
362
-
363
-
364
-
365
-
366
-
367
-
368
-
369
-
370
-
371
-
372
-
373
-
374
-
375
-
376
-
377
-
378
-
379
-
380
-
381
-
382
-
383
-
384
-
385
-
386
-
387
-
388
-
389
-
390
-
391
-
392
-
393
-
394
-
395
-
396
-
397
-
398
-
399
-
400
-
401
-
402
 |
 |

FIAT GROUP
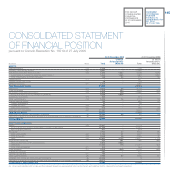
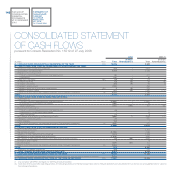
CONSOLIDATED
FINANCIAL
STATEMENTS
AT 31 DECEMBER
2010
NOTES
154
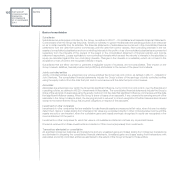
Assets held under finance leases, which provide the Group with substantially all the risks and rewards of ownership, are
recognised as assets of the Group at their fair value or, if lower, at the present value of the minimum lease payments. The
corresponding liability to the lessor is included in the financial statement as a debt. The assets are depreciated by the method
and at the rates indicated below.
Leases where the lessor retains substantially all the risks and rewards of ownership of the assets are classified as operating
leases. Operating lease expenditures are expensed on a straight-line basis over the lease terms.
Depreciation
Depreciation is calculated on a straight-line basis over the estimated useful lives of the assets as follows:
Depreciation rates
Buildings 2.5% - 10%
Plant and machinery 5% - 20%
Industrial and commercial equipment 15% - 25%
Other assets 10% - 33%
Land is not depreciated.
Leased assets
Leased assets include vehicles leased to retail customers by the Group’s leasing companies under operating lease
arrangements. They are stated at cost and depreciated at annual rates of between 20% and 33%.
When such assets cease to be rented and become held for sale, the Group reclassifies their carrying amount to Inventories.
Borrowing costs
Borrowing costs that are directly attributable to the acquisition, construction or production of qualifying assets (as defined under
IAS 23 – Borrowing Costs), which are assets that necessarily take a substantial period of time to get ready for their intended use
or sale, are capitalised and amortised over the useful life of the class of assets to which they refer.
All other borrowing costs are expensed when incurred.
Impairment of assets
The Group reviews, at least annually, the recoverability of the carrying amount of intangible assets (including capitalised
development costs) and property, plant and equipment, in order to determine whether there is any indication that those assets
have suffered an impairment loss. If indications of impairment are present, the carrying amount of the asset is reduced to its
recoverable amount. An intangible asset with an indefinite useful life is tested for impairment annually or more frequently, if there
is an indication that the asset may be impaired.
Where it is not possible to estimate the recoverable amount of an individual asset, the Group estimates the recoverable amount
of the cash-generating unit to which the asset belongs.
The recoverable amount of an asset is the higher of fair value less disposal costs and its value in use. In assessing its value
in use, the pre-tax estimated future cash flows are discounted to their present value using a pre-tax discount rate that
reflects current market assessments of the time value of money and the risks specific to the asset. An impairment loss is
recognised when the recoverable amount is lower than the carrying amount. Where an impairment loss for assets other