Chrysler 2010 Annual Report Download - page 78
Download and view the complete annual report
Please find page 78 of the 2010 Chrysler annual report below. You can navigate through the pages in the report by either clicking on the pages listed below, or by using the keyword search tool below to find specific information within the annual report.-
 1
1 -
2
-
3
-
4
-
5
-
6
-
7
-
8
-
9
-
10
-
11
-
12
-
13
-
14
-
15
-
16
-
17
-
18
-
19
-
20
-
21
-
22
-
23
-
24
-
25
-
26
-
27
-
28
-
29
-
30
-
31
-
32
-
33
-
34
-
35
-
36
-
37
-
38
-
39
-
40
-
41
-
42
-
43
-
44
-
45
-
46
-
47
-
48
-
49
-
50
-
51
-
52
-
53
-
54
-
55
-
56
-
57
-
58
-
59
-
60
-
61
-
62
-
63
-
64
-
65
-
66
-
67
-
 68
68 -
 69
69 -
 70
70 -
 71
71 -
 72
72 -
 73
73 -
 74
74 -
 75
75 -
 76
76 -
 77
77 -
 78
78 -
 79
79 -
 80
80 -
 81
81 -
 82
82 -
 83
83 -
 84
84 -
 85
85 -
 86
86 -
 87
87 -
 88
88 -
89
-
90
-
91
-
92
-
93
-
94
-
95
-
96
-
97
-
98
-
99
-
100
-
101
-
102
-
103
-
104
-
105
-
106
-
107
-
108
-
109
-
110
-
111
-
112
-
113
-
114
-
115
-
116
-
117
-
118
-
119
-
120
-
121
-
122
-
123
-
124
-
125
-
126
-
127
-
128
-
129
-
130
-
131
-
132
-
133
-
134
-
135
-
136
-
137
-
138
-
139
-
140
-
141
-
142
-
143
-
144
-
145
-
146
-
147
-
148
-
149
-
150
-
151
-
152
-
153
-
154
-
155
-
156
-
157
-
158
-
159
-
160
-
161
-
162
-
163
-
164
-
165
-
166
-
167
-
168
-
169
-
170
-
171
-
172
-
173
-
174
-
175
-
176
-
177
-
178
-
179
-
180
-
181
-
182
-
183
-
184
-
185
-
186
-
187
-
188
-
189
-
190
-
191
-
192
-
193
-
194
-
195
-
196
-
197
-
198
-
199
-
200
-
201
-
202
-
203
-
204
-
205
-
206
-
207
-
208
-
209
-
210
-
211
-
212
-
213
-
214
-
215
-
216
-
217
-
218
-
219
-
220
-
221
-
222
-
223
-
224
-
225
-
226
-
227
-
228
-
229
-
230
-
231
-
232
-
233
-
234
-
235
-
236
-
237
-
238
-
239
-
240
-
241
-
242
-
243
-
244
-
245
-
246
-
247
-
248
-
249
-
250
-
251
-
252
-
253
-
254
-
255
-
256
-
257
-
258
-
259
-
260
-
261
-
262
-
263
-
264
-
265
-
266
-
267
-
268
-
269
-
270
-
271
-
272
-
273
-
274
-
275
-
276
-
277
-
278
-
279
-
280
-
281
-
282
-
283
-
284
-
285
-
286
-
287
-
288
-
289
-
290
-
291
-
292
-
293
-
294
-
295
-
296
-
297
-
298
-
299
-
300
-
301
-
302
-
303
-
304
-
305
-
306
-
307
-
308
-
309
-
310
-
311
-
312
-
313
-
314
-
315
-
316
-
317
-
318
-
319
-
320
-
321
-
322
-
323
-
324
-
325
-
326
-
327
-
328
-
329
-
330
-
331
-
332
-
333
-
334
-
335
-
336
-
337
-
338
-
339
-
340
-
341
-
342
-
343
-
344
-
345
-
346
-
347
-
348
-
349
-
350
-
351
-
352
-
353
-
354
-
355
-
356
-
357
-
358
-
359
-
360
-
361
-
362
-
363
-
364
-
365
-
366
-
367
-
368
-
369
-
370
-
371
-
372
-
373
-
374
-
375
-
376
-
377
-
378
-
379
-
380
-
381
-
382
-
383
-
384
-
385
-
386
-
387
-
388
-
389
-
390
-
391
-
392
-
393
-
394
-
395
-
396
-
397
-
398
-
399
-
400
-
401
-
402
 |
 |

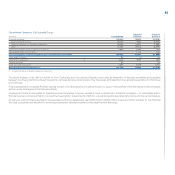
77
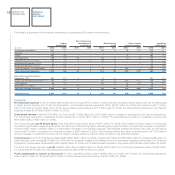
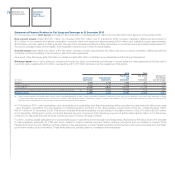
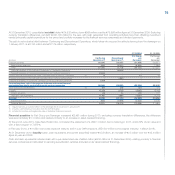
Continuing Operations (Fiat Group post Demerger)
2010 2009 (**)
Industrial Financial Industrial Financial
(€ million) Consolidated Activities Services Consolidated Activities Services
Net revenues 35,880 35,676 270 32,684 32,531 190
Cost of sales 30,718 30,604 180 28,252 28,168 121
Selling, general and administrative 2,956 2,922 34 2,673 2,643 30
Research and development 1,013 1,013 - 1,010 1,010 -
Other income/(expense) (81) (90) 9 (13) (15) 2
TRADING PROFIT/(LOSS) 1,112 1,047 65 736 695 41
Gains/(losses) on disposal of investments 12 12 - 3 3 -
Restructuring costs 118 118 - 168 169 (1)
Other unusual income/(expense) (14) (14) - (193) (214) 21
OPERATING PROFIT/(LOSS) 992 927 65 378 315 63
Financial income/(expense) (400) (400) - (352) (352) -
Result from investments (*) 114 41 73 77 25 52
PROFIT/(LOSS) BEFORE TAXES 706 568 138 103 (12) 115
Income taxes 484 460 24 448 439 9
PROFIT/(LOSS) FROM CONTINUING OPERATIONS 222 108 114 (345) (451) 106
Result from intersegment investments - 114 - - 106 -
PROFIT/(LOSS) FROM CONTINUING OPERATIONS 222 222 114 (345) (345) 106
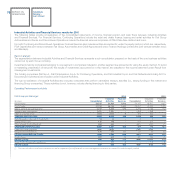
Discontinued Operations (Fiat Industrial Group)
2010 2009 (**)
Industrial Financial Industrial Financial
(€ million) Consolidated Activities Services Consolidated Activities Services
Net revenues 21,342 20,235 1,379 17,968 16,916 1,280
Cost of sales 17,979 17,131 1,120 15,549 14,756 1,021
Selling, general and administrative 1,793 1,657 136 1,636 1,503 133
Research and development 418 418 - 388 388 -
Other income/(expense) (60) (60) - (73) (74) 1
TRADING PROFIT/(LOSS) 1,092 969 123 322 195 127
Gains/(losses) on disposal of investments 3 3 - 1 1 -
Restructuring costs 58 58 - 144 141 3
Other unusual income/(expense) (20) (20) - (198) (198) -
OPERATING PROFIT/(LOSS) 1,017 894 123 (19) (143) 124
Financial income/(expense) (505) (505) - (401) (401) -
Result from investments (*) 64 76 (12) (50) (31) (19)
PROFIT/(LOSS) BEFORE TAXES 576 465 111 (470) (575) 105
Income taxes 198 150 48 33 (4) 37
PROFIT/(LOSS) FROM DISCONTINUED OPERATIONS 378 315 63 (503) (571) 68
Result from intersegment investments - 63 5 - 68 (16)
PROFIT/(LOSS) FROM DISCONTINUED OPERATIONS 378 378 68 (503) (503) 52
(*) This item includes income from investments as well as impairment (losses)/reversals on non-intersegment investments accounted for under the equity method
(**) 2009 figures have been reclassified, as required by IFRS 5