Chrysler 2010 Annual Report Download - page 253
Download and view the complete annual report
Please find page 253 of the 2010 Chrysler annual report below. You can navigate through the pages in the report by either clicking on the pages listed below, or by using the keyword search tool below to find specific information within the annual report.-
 1
1 -
2
-
3
-
4
-
5
-
6
-
7
-
8
-
9
-
10
-
11
-
12
-
13
-
14
-
15
-
16
-
17
-
18
-
19
-
20
-
21
-
22
-
23
-
24
-
25
-
26
-
27
-
28
-
29
-
30
-
31
-
32
-
33
-
34
-
35
-
36
-
37
-
38
-
39
-
40
-
41
-
42
-
43
-
44
-
45
-
46
-
47
-
48
-
49
-
50
-
51
-
52
-
53
-
54
-
55
-
56
-
57
-
58
-
59
-
60
-
61
-
62
-
63
-
64
-
65
-
66
-
67
-
68
-
69
-
70
-
71
-
72
-
73
-
74
-
75
-
76
-
77
-
78
-
79
-
80
-
81
-
82
-
83
-
84
-
85
-
86
-
87
-
88
-
89
-
90
-
91
-
92
-
93
-
94
-
95
-
96
-
97
-
98
-
99
-
100
-
101
-
102
-
103
-
104
-
105
-
106
-
107
-
108
-
109
-
110
-
111
-
112
-
113
-
114
-
115
-
116
-
117
-
118
-
119
-
120
-
121
-
122
-
123
-
124
-
125
-
126
-
127
-
128
-
129
-
130
-
131
-
132
-
133
-
134
-
135
-
136
-
137
-
138
-
139
-
140
-
141
-
142
-
143
-
144
-
145
-
146
-
147
-
148
-
149
-
150
-
151
-
152
-
153
-
154
-
155
-
156
-
157
-
158
-
159
-
160
-
161
-
162
-
163
-
164
-
165
-
166
-
167
-
168
-
169
-
170
-
171
-
172
-
173
-
174
-
175
-
176
-
177
-
178
-
179
-
180
-
181
-
182
-
183
-
184
-
185
-
186
-
187
-
188
-
189
-
190
-
191
-
192
-
193
-
194
-
195
-
196
-
197
-
198
-
199
-
200
-
201
-
202
-
203
-
204
-
205
-
206
-
207
-
208
-
209
-
210
-
211
-
212
-
213
-
214
-
215
-
216
-
217
-
218
-
219
-
220
-
221
-
222
-
223
-
224
-
225
-
226
-
227
-
228
-
229
-
230
-
231
-
232
-
233
-
234
-
235
-
236
-
237
-
238
-
239
-
240
-
241
-
242
-
 243
243 -
 244
244 -
 245
245 -
 246
246 -
 247
247 -
 248
248 -
 249
249 -
 250
250 -
 251
251 -
 252
252 -
 253
253 -
 254
254 -
 255
255 -
 256
256 -
 257
257 -
 258
258 -
 259
259 -
 260
260 -
 261
261 -
 262
262 -
 263
263 -
264
-
265
-
266
-
267
-
268
-
269
-
270
-
271
-
272
-
273
-
274
-
275
-
276
-
277
-
278
-
279
-
280
-
281
-
282
-
283
-
284
-
285
-
286
-
287
-
288
-
289
-
290
-
291
-
292
-
293
-
294
-
295
-
296
-
297
-
298
-
299
-
300
-
301
-
302
-
303
-
304
-
305
-
306
-
307
-
308
-
309
-
310
-
311
-
312
-
313
-
314
-
315
-
316
-
317
-
318
-
319
-
320
-
321
-
322
-
323
-
324
-
325
-
326
-
327
-
328
-
329
-
330
-
331
-
332
-
333
-
334
-
335
-
336
-
337
-
338
-
339
-
340
-
341
-
342
-
343
-
344
-
345
-
346
-
347
-
348
-
349
-
350
-
351
-
352
-
353
-
354
-
355
-
356
-
357
-
358
-
359
-
360
-
361
-
362
-
363
-
364
-
365
-
366
-
367
-
368
-
369
-
370
-
371
-
372
-
373
-
374
-
375
-
376
-
377
-
378
-
379
-
380
-
381
-
382
-
383
-
384
-
385
-
386
-
387
-
388
-
389
-
390
-
391
-
392
-
393
-
394
-
395
-
396
-
397
-
398
-
399
-
400
-
401
-
402
 |
 |

FIAT GROUP
CONSOLIDATED
FINANCIAL
STATEMENTS
AT 31 DECEMBER
2010
NOTES
252
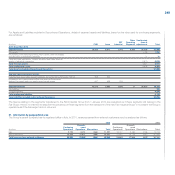
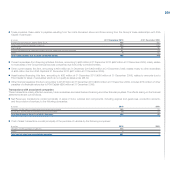
Liquidity risk
Liquidity risk arises if the Group is unable to obtain the funds needed to carry out its operations under economic conditions.
The two main factors that determine the Group’s liquidity situation are on the one hand the funds generated by or used in operating and investing activities
and on the other the debt lending period and its renewal features or the liquidity of the funds employed and market terms and conditions.
As described in the Risk management section, the Group has adopted a series of policies and procedures whose purpose is to optimise the management
of funds and to reduce the liquidity risk, as follows:
centralising the management of receipts and payments, where it may be economical in the context of the local civil, currency and fiscal regulations of the
countries in which the Group is present;
maintaining an adequate level of available liquidity;
diversifying the means by which funds are obtained and maintaining a continuous and active presence on the capital markets;
obtaining adequate credit lines; and
monitoring future liquidity on the basis of business planning.
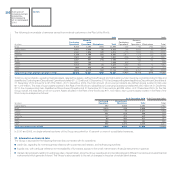
Details as to the repayment structure of the Group’s financial assets and liabilities are provided in Note 19 Current Receivables and in Note 26 Debt.
Details of the repayment structure of derivative financial instruments are provided in Note 21.
Management believes that the funds currently available, in addition to those funds that will be generated from operating and financing activities, will enable
the Fiat Group Post Demerger and the Fiat Industrial Group to satisfy the requirements resulting from their investing activities and their working capital needs
and to fulfil their obligations to repay their debts at their natural due date.
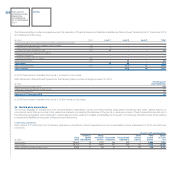
Currency risk
The Group is exposed to risk resulting from changes in exchange rates, which can affect its earnings and equity. In particular:
Where a Group company incurs costs in a currency different from that of its revenues, any change in exchange rates can affect the operating profit/(loss)
of that company. In 2010, the total trade flows exposed to currency risk amounted to the equivalent of 12% of the Group’s turnover from Continuing
Operations, and to the equivalent of 15% of the Group’s turnover from Discontinued Operations.
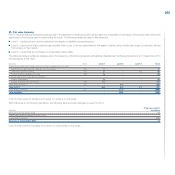
The principal exchange rates to which the businesses in Continuing Operations are exposed are the following:
EUR/USD, relating to sales in dollars made by Italian companies (in particular Ferrari and Maserati) to the North American market and to other markets
in which the US dollar is the trading currency;
EUR/GBP, EUR/CHF, in relation to sales on the UK and Swiss markets;
EUR/PLN, EUR/TRY, relating to manufacturing costs incurred in Poland and Turkey for products sold in the Euro area;
USD/BRL and EUR/BRL, relating to Brazilian manufacturing operations and the related import and export flows.
Taken overall trade flows exposed to changes in these exchange rates in 2010 made up approximately 84% of the exposure to currency risk from trade
transactions.
The principal exchange rates to which Discontinued Operations are exposed are as follows:
EUR/USD, in relation to the production/purchases of the CNH – Case New Holland sector in the Euro area and to sales in dollars made by Iveco;
EUR/GBP, predominately in relation to sales made by Iveco on the UK market and purchases made by the CNH sector in the Euro area;
USD/BRL and EUR/BRL, in relation to production in Brazil and the respective import/export flows;
USD/AUD, mainly in relation to sales made by the CNH sector in Australia;
USD/GBP, in relation to the production/purchases of the CNH sector in the UK.