Chrysler 2010 Annual Report Download - page 194
Download and view the complete annual report
Please find page 194 of the 2010 Chrysler annual report below. You can navigate through the pages in the report by either clicking on the pages listed below, or by using the keyword search tool below to find specific information within the annual report.-
 1
1 -
2
-
3
-
4
-
5
-
6
-
7
-
8
-
9
-
10
-
11
-
12
-
13
-
14
-
15
-
16
-
17
-
18
-
19
-
20
-
21
-
22
-
23
-
24
-
25
-
26
-
27
-
28
-
29
-
30
-
31
-
32
-
33
-
34
-
35
-
36
-
37
-
38
-
39
-
40
-
41
-
42
-
43
-
44
-
45
-
46
-
47
-
48
-
49
-
50
-
51
-
52
-
53
-
54
-
55
-
56
-
57
-
58
-
59
-
60
-
61
-
62
-
63
-
64
-
65
-
66
-
67
-
68
-
69
-
70
-
71
-
72
-
73
-
74
-
75
-
76
-
77
-
78
-
79
-
80
-
81
-
82
-
83
-
84
-
85
-
86
-
87
-
88
-
89
-
90
-
91
-
92
-
93
-
94
-
95
-
96
-
97
-
98
-
99
-
100
-
101
-
102
-
103
-
104
-
105
-
106
-
107
-
108
-
109
-
110
-
111
-
112
-
113
-
114
-
115
-
116
-
117
-
118
-
119
-
120
-
121
-
122
-
123
-
124
-
125
-
126
-
127
-
128
-
129
-
130
-
131
-
132
-
133
-
134
-
135
-
136
-
137
-
138
-
139
-
140
-
141
-
142
-
143
-
144
-
145
-
146
-
147
-
148
-
149
-
150
-
151
-
152
-
153
-
154
-
155
-
156
-
157
-
158
-
159
-
160
-
161
-
162
-
163
-
164
-
165
-
166
-
167
-
168
-
169
-
170
-
171
-
172
-
173
-
174
-
175
-
176
-
177
-
178
-
179
-
180
-
181
-
182
-
183
-
 184
184 -
 185
185 -
 186
186 -
 187
187 -
 188
188 -
 189
189 -
 190
190 -
 191
191 -
 192
192 -
 193
193 -
 194
194 -
 195
195 -
 196
196 -
 197
197 -
 198
198 -
 199
199 -
 200
200 -
 201
201 -
 202
202 -
 203
203 -
 204
204 -
205
-
206
-
207
-
208
-
209
-
210
-
211
-
212
-
213
-
214
-
215
-
216
-
217
-
218
-
219
-
220
-
221
-
222
-
223
-
224
-
225
-
226
-
227
-
228
-
229
-
230
-
231
-
232
-
233
-
234
-
235
-
236
-
237
-
238
-
239
-
240
-
241
-
242
-
243
-
244
-
245
-
246
-
247
-
248
-
249
-
250
-
251
-
252
-
253
-
254
-
255
-
256
-
257
-
258
-
259
-
260
-
261
-
262
-
263
-
264
-
265
-
266
-
267
-
268
-
269
-
270
-
271
-
272
-
273
-
274
-
275
-
276
-
277
-
278
-
279
-
280
-
281
-
282
-
283
-
284
-
285
-
286
-
287
-
288
-
289
-
290
-
291
-
292
-
293
-
294
-
295
-
296
-
297
-
298
-
299
-
300
-
301
-
302
-
303
-
304
-
305
-
306
-
307
-
308
-
309
-
310
-
311
-
312
-
313
-
314
-
315
-
316
-
317
-
318
-
319
-
320
-
321
-
322
-
323
-
324
-
325
-
326
-
327
-
328
-
329
-
330
-
331
-
332
-
333
-
334
-
335
-
336
-
337
-
338
-
339
-
340
-
341
-
342
-
343
-
344
-
345
-
346
-
347
-
348
-
349
-
350
-
351
-
352
-
353
-
354
-
355
-
356
-
357
-
358
-
359
-
360
-
361
-
362
-
363
-
364
-
365
-
366
-
367
-
368
-
369
-
370
-
371
-
372
-
373
-
374
-
375
-
376
-
377
-
378
-
379
-
380
-
381
-
382
-
383
-
384
-
385
-
386
-
387
-
388
-
389
-
390
-
391
-
392
-
393
-
394
-
395
-
396
-
397
-
398
-
399
-
400
-
401
-
402
 |
 |

193
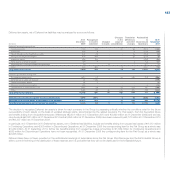
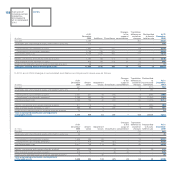
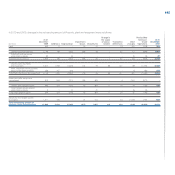
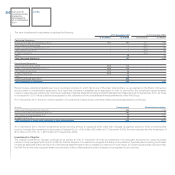
15. Property, plant and equipment
In 2010 and 2009, changes in the gross carrying amount of Property, plant and equipment were as follows:
Reclassified
At 31 Change in to At 31
December the scope of Translation Other Discontinued December
(€ million) 2009 Additions Divestitures consolidation differences changes Operations 2010
Land 612 2 (4) - 14 (42) (210) 372
Owned industrial buildings 5,307 99 (12) 14 161 186 (1,952) 3,803
Industrial buildings leased under finance leases 76 - (1) - - 1 (16) 60
Total Industrial buildings 5,383 99 (13) 14 161 187 (1,968) 3,863
Owned plant, machinery and equipment 27,323 1,098 (551) 180 627 781 (5,720) 23,738
Plant, machinery and equipment leased under finance leases 356 107 - - 1 17 (49) 432
Total Plant, machinery and equipment 27,679 1,205 (551) 180 628 798 (5,769) 24,170
Assets sold with a buy-back commitment 1,218 344 (139) - 6 (262) (1,167) -
Owned other tangible assets 1,834 223 (194) 9 52 43 (683) 1,284
Other tangible assets leased under finance leases 14 1 (1) - - (5) (6) 3
Total Other tangible assets 1,848 224 (195) 9 52 38 (689) 1,287
Advances and tangible assets in progress 1,393 730 (14) 7 50 (1,011) (194) 961
Total gross carrying amount of Property, plant and equipment 38,133 2,604 (916) 210 911 (292) (9,997) 30,653
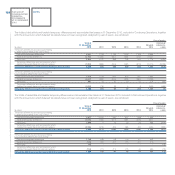
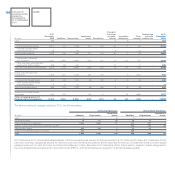
At 31 Change in Reclassified At 31
December the scope of Translation Other to Assets December
(€ million) 2008 Additions Divestitures consolidation differences changes held for sale 2009
Land 594 - - 5 9 4 - 612
Owned industrial buildings 4,897 146 (32) 19 146 131 - 5,307
Industrial buildings leased under finance leases 76 - (1) 8 - (7) - 76
Total Industrial buildings 4,973 146 (33) 27 146 124 - 5,383
Owned plant, machinery and equipment 25,832 1,095 (676) 4 676 392 - 27,323
Plant, machinery and equipment leased under finance leases 331 38 (1) (3) - (9) - 356
Total Plant, machinery and equipment 26,163 1,133 (677) 1 676 383 - 27,679
Assets sold with a buy-back commitment 1,362 244 (154) - 12 (246) - 1,218
Owned other tangible assets 1,736 188 (169) - 43 36 - 1,834
Other tangible assets leased under finance leases 8 6 - - - - - 14
Total Other tangible assets 1,744 194 (169) - 43 36 - 1,848
Advances and tangible assets in progress 1,266 723 (9) - 84 (671) - 1,393
Total gross carrying amount of Property, plant and equipment 36,102 2,440 (1,042) 33 970 (370) - 38,133