Chrysler 2010 Annual Report Download - page 241
Download and view the complete annual report
Please find page 241 of the 2010 Chrysler annual report below. You can navigate through the pages in the report by either clicking on the pages listed below, or by using the keyword search tool below to find specific information within the annual report.-
 1
1 -
2
-
3
-
4
-
5
-
6
-
7
-
8
-
9
-
10
-
11
-
12
-
13
-
14
-
15
-
16
-
17
-
18
-
19
-
20
-
21
-
22
-
23
-
24
-
25
-
26
-
27
-
28
-
29
-
30
-
31
-
32
-
33
-
34
-
35
-
36
-
37
-
38
-
39
-
40
-
41
-
42
-
43
-
44
-
45
-
46
-
47
-
48
-
49
-
50
-
51
-
52
-
53
-
54
-
55
-
56
-
57
-
58
-
59
-
60
-
61
-
62
-
63
-
64
-
65
-
66
-
67
-
68
-
69
-
70
-
71
-
72
-
73
-
74
-
75
-
76
-
77
-
78
-
79
-
80
-
81
-
82
-
83
-
84
-
85
-
86
-
87
-
88
-
89
-
90
-
91
-
92
-
93
-
94
-
95
-
96
-
97
-
98
-
99
-
100
-
101
-
102
-
103
-
104
-
105
-
106
-
107
-
108
-
109
-
110
-
111
-
112
-
113
-
114
-
115
-
116
-
117
-
118
-
119
-
120
-
121
-
122
-
123
-
124
-
125
-
126
-
127
-
128
-
129
-
130
-
131
-
132
-
133
-
134
-
135
-
136
-
137
-
138
-
139
-
140
-
141
-
142
-
143
-
144
-
145
-
146
-
147
-
148
-
149
-
150
-
151
-
152
-
153
-
154
-
155
-
156
-
157
-
158
-
159
-
160
-
161
-
162
-
163
-
164
-
165
-
166
-
167
-
168
-
169
-
170
-
171
-
172
-
173
-
174
-
175
-
176
-
177
-
178
-
179
-
180
-
181
-
182
-
183
-
184
-
185
-
186
-
187
-
188
-
189
-
190
-
191
-
192
-
193
-
194
-
195
-
196
-
197
-
198
-
199
-
200
-
201
-
202
-
203
-
204
-
205
-
206
-
207
-
208
-
209
-
210
-
211
-
212
-
213
-
214
-
215
-
216
-
217
-
218
-
219
-
220
-
221
-
222
-
223
-
224
-
225
-
226
-
227
-
228
-
229
-
230
-
 231
231 -
 232
232 -
 233
233 -
 234
234 -
 235
235 -
 236
236 -
 237
237 -
 238
238 -
 239
239 -
 240
240 -
 241
241 -
 242
242 -
 243
243 -
 244
244 -
 245
245 -
 246
246 -
 247
247 -
 248
248 -
 249
249 -
 250
250 -
 251
251 -
252
-
253
-
254
-
255
-
256
-
257
-
258
-
259
-
260
-
261
-
262
-
263
-
264
-
265
-
266
-
267
-
268
-
269
-
270
-
271
-
272
-
273
-
274
-
275
-
276
-
277
-
278
-
279
-
280
-
281
-
282
-
283
-
284
-
285
-
286
-
287
-
288
-
289
-
290
-
291
-
292
-
293
-
294
-
295
-
296
-
297
-
298
-
299
-
300
-
301
-
302
-
303
-
304
-
305
-
306
-
307
-
308
-
309
-
310
-
311
-
312
-
313
-
314
-
315
-
316
-
317
-
318
-
319
-
320
-
321
-
322
-
323
-
324
-
325
-
326
-
327
-
328
-
329
-
330
-
331
-
332
-
333
-
334
-
335
-
336
-
337
-
338
-
339
-
340
-
341
-
342
-
343
-
344
-
345
-
346
-
347
-
348
-
349
-
350
-
351
-
352
-
353
-
354
-
355
-
356
-
357
-
358
-
359
-
360
-
361
-
362
-
363
-
364
-
365
-
366
-
367
-
368
-
369
-
370
-
371
-
372
-
373
-
374
-
375
-
376
-
377
-
378
-
379
-
380
-
381
-
382
-
383
-
384
-
385
-
386
-
387
-
388
-
389
-
390
-
391
-
392
-
393
-
394
-
395
-
396
-
397
-
398
-
399
-
400
-
401
-
402
 |
 |

FIAT GROUP
CONSOLIDATED
FINANCIAL
STATEMENTS
AT 31 DECEMBER
2010
NOTES
240
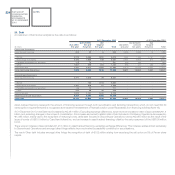
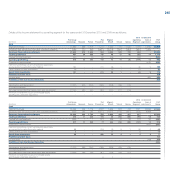
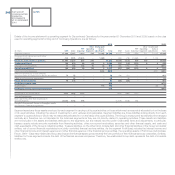
27. Trade payables
An analysis by due date of trade payables is as follows:
At 31 December 2010 At 31 December 2009
Due between Due Due between Due
Due within one and beyond Due within one and beyond
(€ million) one year five years five years Total one year five years five years Total
Trade payables classified as Continuing Operations 9,338 6 1
9,345 12,281 13 1 12,295
Trade payables classified as Discontinued Operations 3,901 4 1
3,906 - - - -
Trade payables 13,239 10 2 13,251 12,281 13 1 12,295
The carrying amount of Trade payables is considered in line with their fair value at the balance sheet date.
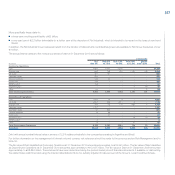
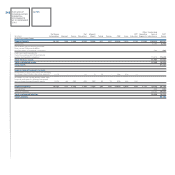
28. Other current liabilities
An analysis of Other current liabilities is as follows:
At 31 December 2010 At 31 December 2009
Continuing Discontinued
(€ million) Operations Operations Total Total
Advances on buy-back agreements 822 1,010 1,832 1.885
Indirect tax payables 1,063 309 1,372 1.082
Accrued expenses and deferred income 806 340 1,146 1.078
Payables to personnel 269 190 459 468
Social security payables 280 159 439 423
Amounts due to customers for contract work (Note 18) 105 - 105 81
Other 563 334 897 848
Total Other current liabilities 3,908 2,342 6,250 5.865
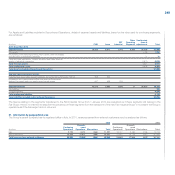
An analysis of Other current liabilities (excluding Accrued expenses and deferred income) by due date is as follows:
At 31 December 2010 At 31 December 2009
due between due due between due
due within one and beyond due within one and beyond
(€ million) one year five years five years Total one year five years five years Total
Other current liabilities (excluding Accrued expenses
and deferred income) classified as Continuing Operations 2,544 545 13 3,102 3,859 891 37 4,787
Other current liabilities (excluding Accrued expenses and
deferred income) classified as Discontinued Operations 1,361 618 23 2,002 - - - -
Total Other current liabilities (excluding Accrued
expenses and deferred income) 3,905 1,163 36 5,104 3,859 891 37 4,787
The item Advances on buy-back agreements refers to agreements entered into by the Group during the year or which still remain effective at the balance
sheet date. With respect to Continuing Operations, €822 million relates to assets included in Inventories, while with respect to Discontinued Operations
€1,010 million relates to assets included in Property, plant and equipment. The item Advances on buy-back agreements represents the following:
at the date of the sale, the price received for the product is recognised as an advance in liabilities;
subsequently, since the difference between the original sales price and the repurchase price is recognised in the income statement as operating lease
instalments on a straight-line basis over the lease term, the balance represents the remaining lease instalments yet to be recognised in income plus the
repurchase price.
The carrying amount of Other current liabilities is considered in line with their fair value.