Chrysler 2010 Annual Report Download - page 117
Download and view the complete annual report
Please find page 117 of the 2010 Chrysler annual report below. You can navigate through the pages in the report by either clicking on the pages listed below, or by using the keyword search tool below to find specific information within the annual report.-
 1
1 -
2
-
3
-
4
-
5
-
6
-
7
-
8
-
9
-
10
-
11
-
12
-
13
-
14
-
15
-
16
-
17
-
18
-
19
-
20
-
21
-
22
-
23
-
24
-
25
-
26
-
27
-
28
-
29
-
30
-
31
-
32
-
33
-
34
-
35
-
36
-
37
-
38
-
39
-
40
-
41
-
42
-
43
-
44
-
45
-
46
-
47
-
48
-
49
-
50
-
51
-
52
-
53
-
54
-
55
-
56
-
57
-
58
-
59
-
60
-
61
-
62
-
63
-
64
-
65
-
66
-
67
-
68
-
69
-
70
-
71
-
72
-
73
-
74
-
75
-
76
-
77
-
78
-
79
-
80
-
81
-
82
-
83
-
84
-
85
-
86
-
87
-
88
-
89
-
90
-
91
-
92
-
93
-
94
-
95
-
96
-
97
-
98
-
99
-
100
-
101
-
102
-
103
-
104
-
105
-
106
-
 107
107 -
 108
108 -
 109
109 -
 110
110 -
 111
111 -
 112
112 -
 113
113 -
 114
114 -
 115
115 -
 116
116 -
 117
117 -
 118
118 -
 119
119 -
 120
120 -
 121
121 -
 122
122 -
 123
123 -
 124
124 -
 125
125 -
 126
126 -
 127
127 -
128
-
129
-
130
-
131
-
132
-
133
-
134
-
135
-
136
-
137
-
138
-
139
-
140
-
141
-
142
-
143
-
144
-
145
-
146
-
147
-
148
-
149
-
150
-
151
-
152
-
153
-
154
-
155
-
156
-
157
-
158
-
159
-
160
-
161
-
162
-
163
-
164
-
165
-
166
-
167
-
168
-
169
-
170
-
171
-
172
-
173
-
174
-
175
-
176
-
177
-
178
-
179
-
180
-
181
-
182
-
183
-
184
-
185
-
186
-
187
-
188
-
189
-
190
-
191
-
192
-
193
-
194
-
195
-
196
-
197
-
198
-
199
-
200
-
201
-
202
-
203
-
204
-
205
-
206
-
207
-
208
-
209
-
210
-
211
-
212
-
213
-
214
-
215
-
216
-
217
-
218
-
219
-
220
-
221
-
222
-
223
-
224
-
225
-
226
-
227
-
228
-
229
-
230
-
231
-
232
-
233
-
234
-
235
-
236
-
237
-
238
-
239
-
240
-
241
-
242
-
243
-
244
-
245
-
246
-
247
-
248
-
249
-
250
-
251
-
252
-
253
-
254
-
255
-
256
-
257
-
258
-
259
-
260
-
261
-
262
-
263
-
264
-
265
-
266
-
267
-
268
-
269
-
270
-
271
-
272
-
273
-
274
-
275
-
276
-
277
-
278
-
279
-
280
-
281
-
282
-
283
-
284
-
285
-
286
-
287
-
288
-
289
-
290
-
291
-
292
-
293
-
294
-
295
-
296
-
297
-
298
-
299
-
300
-
301
-
302
-
303
-
304
-
305
-
306
-
307
-
308
-
309
-
310
-
311
-
312
-
313
-
314
-
315
-
316
-
317
-
318
-
319
-
320
-
321
-
322
-
323
-
324
-
325
-
326
-
327
-
328
-
329
-
330
-
331
-
332
-
333
-
334
-
335
-
336
-
337
-
338
-
339
-
340
-
341
-
342
-
343
-
344
-
345
-
346
-
347
-
348
-
349
-
350
-
351
-
352
-
353
-
354
-
355
-
356
-
357
-
358
-
359
-
360
-
361
-
362
-
363
-
364
-
365
-
366
-
367
-
368
-
369
-
370
-
371
-
372
-
373
-
374
-
375
-
376
-
377
-
378
-
379
-
380
-
381
-
382
-
383
-
384
-
385
-
386
-
387
-
388
-
389
-
390
-
391
-
392
-
393
-
394
-
395
-
396
-
397
-
398
-
399
-
400
-
401
-
402
 |
 |
REPORT ON
OPERATIONS
OPERATING
PERFORMANCE:
CONTINUING
OPERATIONS
116
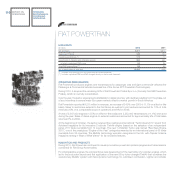
METALLURGICAL PRODUCTS
Teksid
HIGHLIGHTS
(€ million) 2010 2009
Net revenues 776 578
Trading profit/(loss) 17 (12)
Operating profit/(loss) (*) 17 (14)
Investments in tangible and intangible assets 31 33
Total R&D expenditure (**) 2 2
No. of employees at year end 7,275 6,194
(*) Includes restructuring costs and other unusual income/(expense)
(**) Includes capitalized R&D and R&D charged directly to the income statement
OPERATING PERFORMANCE
Following the global economic crisis, which impacted demand levels in 2009, moderate increases were
experienced during 2010 although in several areas demand remained below pre-crisis levels.
The rates of increase in Teksid’s two principal business segments varied from market to market. In the
passenger car and light commercial vehicle market, global production was up over 2009, with the NAFTA
region recording a more significant overall increase than Europe. Production levels were also strong in Brazil.
The heavy vehicle market was up sharply in all regions, with Europe registering a significant increase over the
very low levels experienced in 2009.
With the upturn in economic conditions, the sector achieved a notable improvement in profitability and revenues
were up 34.3% for the year.
The Cast Iron business unit recorded a 21.8% increase in volumes over 2009, with the most notable
improvement in the heavy vehicle segment, particularly in Europe (+18.1%) and the NAFTA region (+47.2%),
where the heavy segment is the sector’s primary area of focus, and in Brazil (+19.9%). Revenues for the
business unit were up 35.9%, driven by higher volumes as well as higher pricing to recover increases in raw
material costs.
Teksid’s Cast Iron business unit also operates in China through Hua Dong Teksid Automotive Foundry Co. Ltd.,
a joint venture with the SAIC group which is accounted for under the equity method. In 2010, the company
recorded a 9.1% decrease in delivery volumes associated with a decline in exports to Italy.
The Aluminum business unit posted a 15.3% increase in volumes and a 26.5% increase in revenues, principally
driven by higher volumes and price increases to recover higher raw material costs.