Chrysler 2010 Annual Report Download - page 85
Download and view the complete annual report
Please find page 85 of the 2010 Chrysler annual report below. You can navigate through the pages in the report by either clicking on the pages listed below, or by using the keyword search tool below to find specific information within the annual report.-
 1
1 -
2
-
3
-
4
-
5
-
6
-
7
-
8
-
9
-
10
-
11
-
12
-
13
-
14
-
15
-
16
-
17
-
18
-
19
-
20
-
21
-
22
-
23
-
24
-
25
-
26
-
27
-
28
-
29
-
30
-
31
-
32
-
33
-
34
-
35
-
36
-
37
-
38
-
39
-
40
-
41
-
42
-
43
-
44
-
45
-
46
-
47
-
48
-
49
-
50
-
51
-
52
-
53
-
54
-
55
-
56
-
57
-
58
-
59
-
60
-
61
-
62
-
63
-
64
-
65
-
66
-
67
-
68
-
69
-
70
-
71
-
72
-
73
-
74
-
 75
75 -
 76
76 -
 77
77 -
 78
78 -
 79
79 -
 80
80 -
 81
81 -
 82
82 -
 83
83 -
 84
84 -
 85
85 -
 86
86 -
 87
87 -
 88
88 -
 89
89 -
 90
90 -
 91
91 -
 92
92 -
 93
93 -
 94
94 -
 95
95 -
96
-
97
-
98
-
99
-
100
-
101
-
102
-
103
-
104
-
105
-
106
-
107
-
108
-
109
-
110
-
111
-
112
-
113
-
114
-
115
-
116
-
117
-
118
-
119
-
120
-
121
-
122
-
123
-
124
-
125
-
126
-
127
-
128
-
129
-
130
-
131
-
132
-
133
-
134
-
135
-
136
-
137
-
138
-
139
-
140
-
141
-
142
-
143
-
144
-
145
-
146
-
147
-
148
-
149
-
150
-
151
-
152
-
153
-
154
-
155
-
156
-
157
-
158
-
159
-
160
-
161
-
162
-
163
-
164
-
165
-
166
-
167
-
168
-
169
-
170
-
171
-
172
-
173
-
174
-
175
-
176
-
177
-
178
-
179
-
180
-
181
-
182
-
183
-
184
-
185
-
186
-
187
-
188
-
189
-
190
-
191
-
192
-
193
-
194
-
195
-
196
-
197
-
198
-
199
-
200
-
201
-
202
-
203
-
204
-
205
-
206
-
207
-
208
-
209
-
210
-
211
-
212
-
213
-
214
-
215
-
216
-
217
-
218
-
219
-
220
-
221
-
222
-
223
-
224
-
225
-
226
-
227
-
228
-
229
-
230
-
231
-
232
-
233
-
234
-
235
-
236
-
237
-
238
-
239
-
240
-
241
-
242
-
243
-
244
-
245
-
246
-
247
-
248
-
249
-
250
-
251
-
252
-
253
-
254
-
255
-
256
-
257
-
258
-
259
-
260
-
261
-
262
-
263
-
264
-
265
-
266
-
267
-
268
-
269
-
270
-
271
-
272
-
273
-
274
-
275
-
276
-
277
-
278
-
279
-
280
-
281
-
282
-
283
-
284
-
285
-
286
-
287
-
288
-
289
-
290
-
291
-
292
-
293
-
294
-
295
-
296
-
297
-
298
-
299
-
300
-
301
-
302
-
303
-
304
-
305
-
306
-
307
-
308
-
309
-
310
-
311
-
312
-
313
-
314
-
315
-
316
-
317
-
318
-
319
-
320
-
321
-
322
-
323
-
324
-
325
-
326
-
327
-
328
-
329
-
330
-
331
-
332
-
333
-
334
-
335
-
336
-
337
-
338
-
339
-
340
-
341
-
342
-
343
-
344
-
345
-
346
-
347
-
348
-
349
-
350
-
351
-
352
-
353
-
354
-
355
-
356
-
357
-
358
-
359
-
360
-
361
-
362
-
363
-
364
-
365
-
366
-
367
-
368
-
369
-
370
-
371
-
372
-
373
-
374
-
375
-
376
-
377
-
378
-
379
-
380
-
381
-
382
-
383
-
384
-
385
-
386
-
387
-
388
-
389
-
390
-
391
-
392
-
393
-
394
-
395
-
396
-
397
-
398
-
399
-
400
-
401
-
402
 |
 |

REPORT ON
OPERATIONS
FINANCIAL
REVIEW –
FIAT GROUP
84
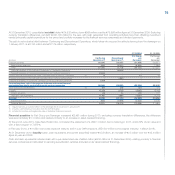
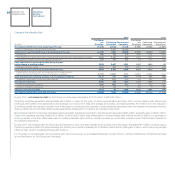
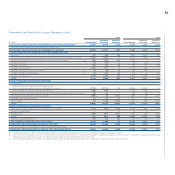
Change in Net Industrial Debt
2010 2009
Fiat Group Fiat Group
pre Continuing Discontinued pre Continuing Discontinued
(€ million) Demerger Operations Operations Demerger Operations Operations
Net industrial (debt)/cash at the beginning of the year (4,418) (3,103) (1,315) (5,949) (4,668) (1,281)
Effect of Demerger on the allocation of net debt - 2,521 (2,521) - - -
Adjusted net industrial (debt)/cash at the beginning of the year (4,418) (582) (3,836) (5,949) (4,668) (1,281)
Profit/(loss) 600 222 378 (848) (345) (503)
Amortization and depreciation (net of vehicles sold under buy-back commitments or leased) 2,846 2,184 662 2,667 2,034 633
Change in provisions for risks and charges and similar 552 201 351 118 150 (32)
Cash from/(used in) operating activities during the year
before change in working capital 3,998 2,607 1,391 1,937 1,839 98
Change in working capital 1,886 893 993 2,564 1,676 888
Cash from/(used in) operating activities during the year 5,884 3,500 2,384 4,501 3,515 986
Investments in property, plant and equipment and intangible assets
(net of vehicles sold under buy-back commitments or leased) (3,712) (2,859) (871) (3,382) (2,682) (706)
Cash from/(used in) operating activities, net of capital expenditures 2,172 641 1,513 1,119 833 280
Change in consolidation scope and other changes (76) (172) 114 525 492 39
Net industrial cash flow 2,096 469 1,627 1,644 1,325 319
Capital increases and dividends (238) (545) 307 (20) 235 (255)
Currency translation differences 118 116 2 (93) 5 (98)
Change in net industrial debt 1,976 40 1,936 1,531 1,565 (34)
Net industrial (debt)/cash at the end of the year (2,442) (542) (1,900) (4,418) (3,103) (1,315)
During 2010, net industrial debt for Fiat Group pre Demerger decreased €1,976 million to €2,442 million.
Operating activities generated approximately €5.9 billion in cash for the year, of which approximately €4 billion from income-related cash inflows (net
profit plus amortization and depreciation and changes in provisions for risks and charges and similar), and approximately €1.9 billion from the reduction
in working capital that resulted primarily from a decrease in inventories and increase in trade payables associated with the increase in business volumes.
These positive items more than offset capital expenditure (totaling €3,712 million) and dividend payments.
Net industrial debt for Continuing Operations (excluding debt transferred pursuant to the Demerger) decreased €40 million during the year to €542 million.
Cash from operating activities totaled €3.5 billion, of which €2.6 billion was attributable to income-related cash inflows and €0.9 billion to a decrease in
working capital, more than offset cash used in investing activities (€2.9 billion), capital increases for companies included under Discontinued Operations
and dividend payments.
During 2010, net industrial debt for Discontinued Operations, net of the debt transferred as a result of the Demerger, decreased €1.9 billion primarily due to
the strong operating cash flow (approximately €2.4 billion) and capital increases (net of dividend distributions) totaling €0.3 billion, which were only partially
offset by cash used in investing activities (€0.9 billion).
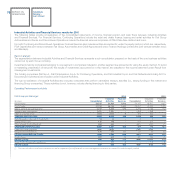
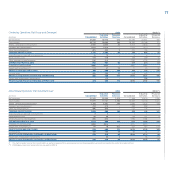
For the sake of completeness, and in keeping with the previous year, an annotated Statement of Cash Flow by Activity (Industrial and Financial Services)
is provided below for Fiat Group pre Demerger.